1. Executive Summary
India's e-commerce sector has moved from a metro-led online retail channel to a broad digital commerce ecosystem spanning marketplaces, D2C brands, B2B commerce, quick commerce, social commerce, digital services and public procurement. Current industry estimates differ because some reports measure total e-commerce GMV while others measure e-retail GMV; therefore, market-size numbers should not be mixed without defining the metric.
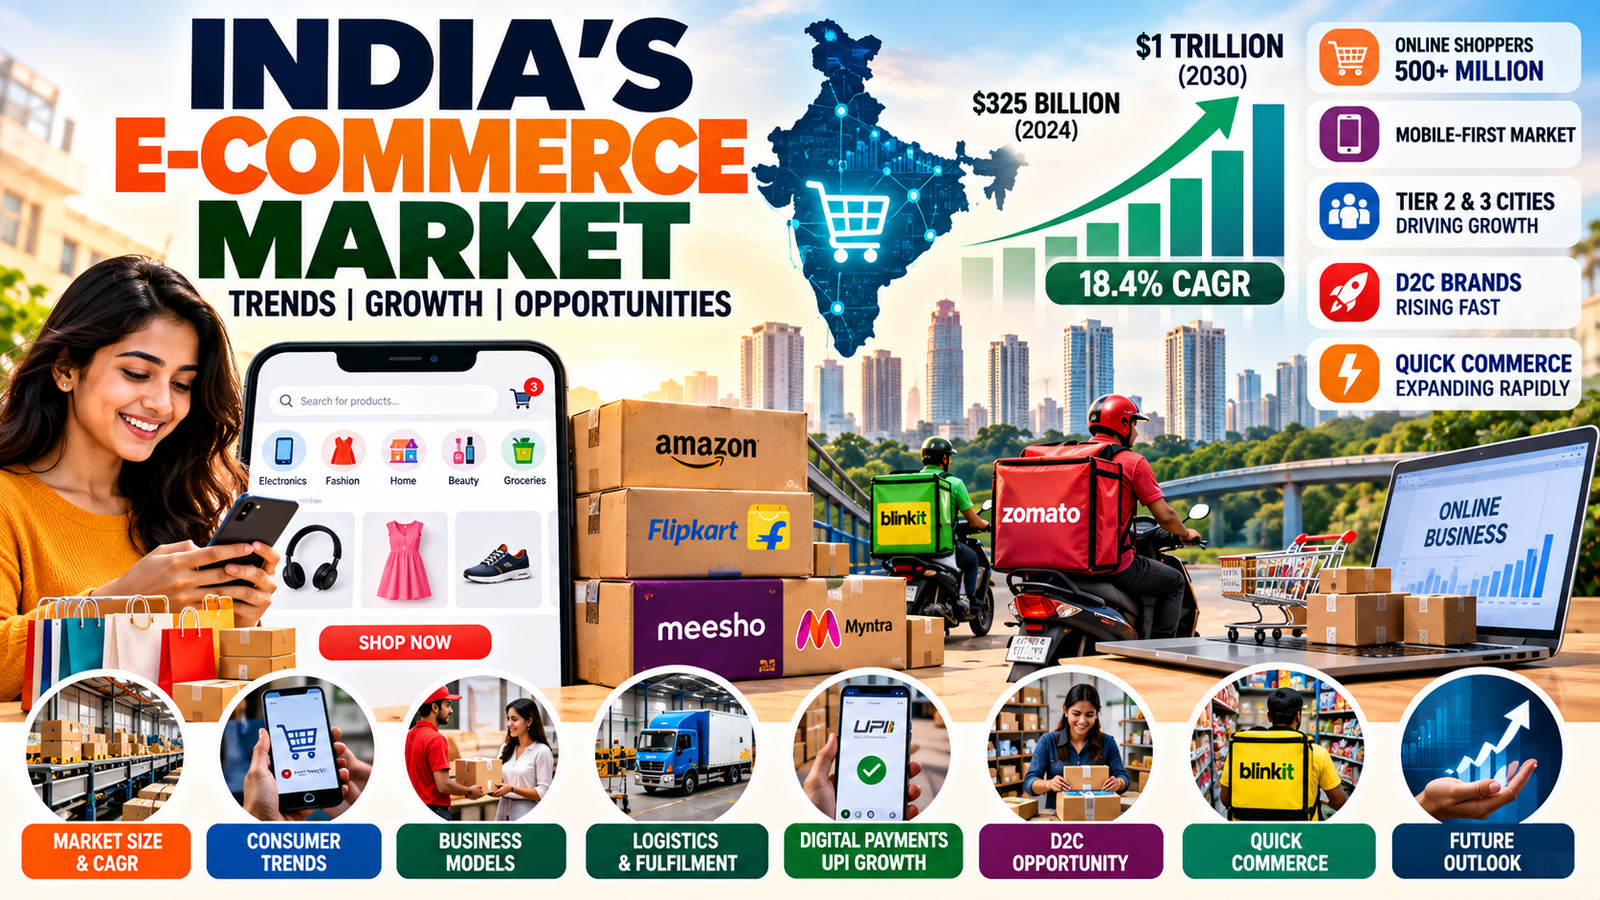
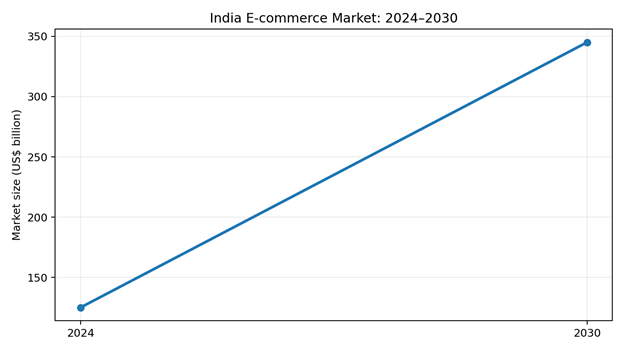
·IBEF reports India's e-commerce industry at about US$125 billion in 2024 and projects US$345 billion by 2030, implying an 18.4% CAGR.
·Trade.gov's April 2026 country guide projects India's e-commerce market to reach about US$325 billion by 2030.
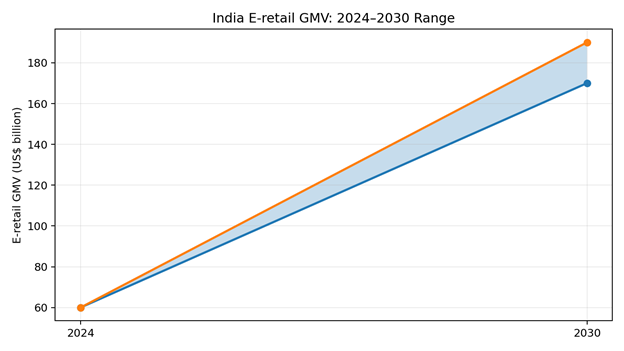
·IBEF/Bain reports India's e-retail GMV at about US$60 billion in 2024 and projects US$170–190 billion by 2030.
·India had roughly 290–300 million online shoppers in 2025, according to IBEF, making India one of the world's largest online shopper markets.
·Tier-2 and smaller cities are becoming the next major demand engine; IBEF estimates they contributed around 65% of new online shoppers in 2025.
·Quick commerce has become a major structural segment rather than a temporary delivery trend.
·Digital payments, logistics, smartphones, D2C, social commerce and AI are lowering the friction of online buying and selling.
·At the same time, platform dependence creates risks around commissions, discounts, ranking, customer-data access, contract terms and channel concentration.
2. Market Definition: What Exactly Is 'E-commerce'?
E-commerce includes buying, selling, marketing or distribution of goods—including digital products—and services through electronic networks. The 2020 CCI study covered consumer goods, accommodation and food services and emphasized that online commerce affects different product markets differently.
Term |
Meaning / use in this report |
E-commerce |
Broad digital buying/selling ecosystem across goods and services |
E-retail |
Online retail of goods to consumers; narrower than the full e-commerce ecosystem |
GMV |
Gross merchandise value; value of merchandise/orders transacted through a platform or market |
Marketplace |
Platform connecting buyers and independent sellers/service providers |
D2C |
Brand sells directly to consumers through its own digital channels or a controlled digital storefront |
Quick commerce |
Ultra-fast delivery model, typically supported by local fulfilment/dark-store networks |
B2B commerce |
Digital transactions between businesses, including wholesale/procurement platforms |
3. Market Size & CAGR
Source / metric |
Base |
Forecast |
Growth |
IBEF – broad e-commerce industry |
US$125bn (2024) |
US$345bn (2030) |
18.4% CAGR |
Trade.gov – e-commerce market |
— |
~US$325bn (2030) |
Fast-growing market; exact base not stated on page |
Bain/Flipkart via IBEF – e-retail GMV |
US$60bn (2024) |
US$170–190bn (2030) |
>18% annual growth expected |
IBEF – D2C |
— |
US$60bn (2030) |
~40% CAGR cited |
IBEF – quick commerce |
US$7–8bn (FY25) |
US$65–70bn (2030) |
Very high growth |
Important: the 18.4% CAGR is calculated/quoted for the US$125bn-to-US$345bn broad market series. Do not label US$60bn-to-US$190bn e-retail as the same market; it is a narrower GMV measure.
4. Why India's E-commerce Market Is Growing
·Large and increasingly connected consumer base.
·Smartphone-led discovery, comparison and purchasing.
·Digital payments and UPI reducing transaction friction.
·Improving logistics, warehousing and last-mile networks.
·Growing consumer acceptance outside metros.
·Expansion of D2C and digitally native brands.
·Quick commerce changing expectations around convenience and delivery time.
·Marketplace access allowing small businesses to reach customers without building a complete retail network.
·Social platforms and messaging channels increasingly influencing discovery and conversion.
·AI improving search, recommendations, customer support, cataloguing, advertising and operational efficiency.
5. Consumer & Shopper Landscape
IBEF reports nearly 290–300 million online shoppers in 2025, with Tier-2+ cities contributing around 65% of incremental shoppers. It also notes that shopper penetration in smaller cities remains only around 25–30% of internet users, suggesting substantial headroom.
Consumer factor |
Business implication |
Price |
Transparent pricing increases competition and makes margin management critical |
Discounts |
Can accelerate acquisition but may train customers to wait for offers |
Delivery time |
Fast delivery is becoming a competitive differentiator |
Seller ratings/reviews |
Trust and conversion depend heavily on social proof |
Availability |
Stock-outs directly lose demand and can hurt ranking |
Returns |
Can materially change contribution margin, especially in fashion |
User experience |
Search, product information, checkout and support affect conversion |
Regional demand |
Local language, local assortment and regional fulfilment can unlock Tier-2/3 markets |
6. Tier-2, Tier-3 & Rural Opportunity
The next phase of e-commerce growth is increasingly about penetration rather than simply adding metro users. Smaller-city consumers are gaining access to wider assortments and faster fulfilment, while sellers can reach markets that were previously expensive to serve.
·Build regional-language product content and customer support.
·Use localised SEO and marketplace listings.
·Create city/region-specific assortment where demand warrants it.
·Use distributed fulfilment rather than shipping every order from one metro warehouse.
·Design COD, prepaid and return policies according to category economics.
·Use WhatsApp and social commerce for assisted selling and repeat orders.
7. E-commerce Business Models in India
Model |
How it works |
Revenue source |
Main challenge |
Marketplace |
Connects sellers and buyers |
Commission, ads, logistics, subscriptions |
Network effects and seller quality |
Inventory-led |
Platform/retailer owns inventory |
Product margin |
Inventory risk and working capital |
D2C |
Brand sells directly online |
Product margin + repeat purchases |
Customer acquisition cost |
B2B marketplace |
Businesses buy/sell digitally |
Commission, subscription, financing/logistics |
Trust and credit risk |
Quick commerce |
Local inventory + rapid delivery |
Product margin, delivery, ads, subscriptions |
Dense fulfilment economics |
Social commerce |
Discovery and purchase through social/messaging |
Margin, commissions, ads |
Attribution and trust |
C2C |
Consumers transact with consumers |
Listing/payment/services |
Trust, fraud and moderation |
Omnichannel |
Online + physical stores integrated |
Product margin + services |
Inventory and customer-data integration |
B2G / GeM |
Government procurement digitally |
Supplier sales/services |
Tender and compliance requirements |
8. Marketplace vs D2C: Strategic Comparison
Factor |
Marketplace |
Own D2C |
Customer acquisition |
Platform traffic available |
Brand must generate traffic |
Customer data |
More limited / platform controlled |
Greater first-party control, subject to law/policy |
Commission |
Yes |
No marketplace commission, but payment/technology costs |
Competition |
High side-by-side comparison |
Brand controls merchandising |
Trust |
Marketplace reputation helps |
Brand must build trust |
Margin |
Often lower after fees/ads |
Potentially higher gross contribution |
Speed to market |
Fast |
Slower initial build |
Long-term asset |
Seller account + reviews |
Customer relationships + brand + owned channel |
Best practice for many brands is not 'marketplace OR D2C' but marketplace for discovery and volume plus D2C/CRM for repeat purchase, loyalty and customer economics.
9. Quick Commerce: The New Growth Engine
IBEF estimates India's quick-commerce segment at roughly US$7–8 billion in FY25 and projects US$65–70 billion by 2030. Another IBEF industry presentation states quick commerce was already close to 10% of India's e-retail market in 2025 and could reach roughly 20% by 2030.
·Quick commerce works best where order density supports local fulfilment.
·High-frequency categories such as grocery, beverages, personal care and convenience products are natural fits.
·Brands gain incremental discovery but must manage platform fees, trade promotions and margins.
·Advertising inside quick-commerce apps is becoming increasingly important.
·Dark-store density and route efficiency determine the economics.
10. D2C Opportunity
IBEF cites India's D2C market as a high-growth segment, with a projection of about US$60 billion by 2030 and a cited growth rate of around 40% CAGR. D2C can be attractive because brands can control product presentation, pricing architecture, CRM and repeat-purchase journeys, but acquisition costs can become a major constraint.
D2C metric |
What to monitor |
CAC |
Cost to acquire a first-time customer |
AOV |
Average order value |
Gross margin |
Margin before variable fulfilment/marketing costs |
Contribution margin |
Revenue less product, payment, fulfilment, returns and variable marketing costs |
Repeat rate |
Share of customers purchasing again |
LTV |
Lifetime contribution/profit potential |
Refund/return rate |
Especially critical in fashion and high-consideration categories |
Payback period |
Time required to recover CAC |
11. Marketplace Economics: Why GMV Is Not Revenue
A common mistake in e-commerce analysis is treating GMV as platform revenue. If a marketplace processes ₹100 crore of GMV and earns an effective 10% take rate, its platform revenue before other income/cost adjustments would be approximately ₹10 crore. Advertising, logistics, subscriptions and other services can add revenue.
Illustrative GMV |
10% effective take rate |
Platform revenue before other income |
₹1 crore |
10% |
₹10 lakh |
₹10 crore |
10% |
₹1 crore |
₹100 crore |
10% |
₹10 crore |
₹1,000 crore |
10% |
₹100 crore |
These are illustrations only. Actual take rates vary by category, seller contract, services used and platform.
12. Unit Economics for an Online Product Business
A sustainable e-commerce business should calculate contribution per order before scaling advertising.
Illustrative order economics |
₹ |
Selling price / AOV |
1,000 |
COGS |
450 |
Marketplace/payment/transaction costs |
100 |
Fulfilment + shipping |
90 |
Packaging |
25 |
Expected returns/claims |
35 |
Contribution before marketing |
300 |
CAC |
180 |
Contribution after CAC |
120 |
The ₹120 contribution is illustrative. The key lesson is that a business can show strong revenue growth and still lose money if CAC, returns, discounts and fulfilment costs are not controlled.
13. Customer Acquisition & Marketing
·Search demand: SEO, Google Shopping, category pages and product-led content.
·Marketplace advertising: sponsored listings and retail media.
·Meta/Instagram: discovery, retargeting, creator-led content and catalog ads.
·YouTube/video: demonstrations, reviews and problem-solution content.
·Influencer/creator commerce: particularly effective in beauty, fashion, food and lifestyle.
·WhatsApp: assisted selling, abandoned-cart recovery and repeat-order communication.
·Email/SMS/push: retention and lifecycle marketing.
·Referral and loyalty: reduce dependence on paid acquisition.
14. SEO & Organic Opportunity in E-commerce
E-commerce SEO is not limited to ranking the homepage. The strongest architecture usually combines category pages, product pages, brand pages, comparison pages, location pages where relevant, buying guides, FAQs and editorial content.
·Build crawlable category → subcategory → product architecture.
·Prevent duplicate/faceted URLs from creating index bloat.
·Use Product, Offer, Review and Breadcrumb structured data where eligible.
·Create unique product descriptions and specifications.
·Optimize internal links around commercial entities and categories.
·Build comparison and buying-guide content to capture mid-funnel demand.
·Use programmatic SEO only where each page has genuinely useful, differentiated data.
·Track organic revenue, not only rankings and traffic.
15. Logistics & Fulfilment
Fulfilment model |
Best use |
Trade-off |
Central warehouse |
Wide national assortment |
Longer delivery to distant markets |
Regional warehouse |
Faster regional delivery |
More inventory duplication |
Marketplace fulfilment |
Fast marketplace reach |
Fees and platform dependence |
3PL |
Flexible scaling |
Less operational control |
Dark store |
High-density quick commerce |
Requires local order volume |
Store fulfilment |
Omnichannel retailers |
Inventory accuracy becomes critical |
Drop-ship |
Low inventory ownership |
Supplier quality and delivery control |
16. Payments & Digital Infrastructure
Digital payments are a core enabler of e-commerce. IBEF reports that digital payment transaction volume grew 35.04% and value 18.04% in FY2024-25, with UPI accounting for 81% of total digital payment volume during the year. This infrastructure supports both online commerce and assisted digital buying.
17. ONDC & Open Digital Commerce
ONDC is designed as an open network approach to digital commerce, intended to reduce dependence on a small number of closed platforms and broaden participation. Invest India's sector material identifies ONDC among government initiatives supporting open digital networks for goods and services.
·Potentially broadens buyer/seller discovery.
·Can support interoperability across network participants.
·May create opportunities for smaller sellers and local businesses.
·Success still depends on catalogue quality, fulfilment, customer experience and network adoption.
18. Government & Regulatory Framework
The CCI market study and PIB material show that e-commerce is governed through multiple laws and policies rather than a single e-commerce law. The framework includes competition, consumer protection, IT, foreign exchange, payments, companies, GST and sector-specific rules.
Area |
Key consideration |
FDI |
Marketplace and inventory models have different rules; verify current DPIIT policy before structuring foreign investment |
Consumer protection |
E-commerce rules cover disclosures, returns/refunds, warranties and related consumer information |
GST |
Registration, invoicing, TCS and place-of-supply issues depend on the model |
Data protection |
Digital Personal Data Protection Act, 2023 and applicable rules/requirements matter for customer data |
Competition |
Pricing, preferential treatment, exclusivity and other platform conduct can attract scrutiny |
Payments |
Payment systems must comply with applicable RBI/payment regulations |
Product compliance |
Legal metrology, food, cosmetics, electronics and other sector rules can apply depending on product |
Regulations change. The above is a business-planning summary, not legal advice.
19. Competition: Lessons from the CCI Market Study
The Competition Commission of India's Market Study on E-commerce in India, dated January 2020, remains useful for understanding platform economics and seller concerns, although many market-size figures in that study are now outdated. The study covered 16 platforms, 164 business entities and 7 payment providers.
·Marketplace concentration can create strong network effects: more buyers attract sellers and more sellers attract buyers.
·Sellers reported concerns about opaque search ranking and the relationship between paid advertising, ratings, conversion and visibility.
·Platform-to-business bargaining power can become asymmetric when sellers depend heavily on a few large platforms.
·Deep discounts can acquire customers but may pressure seller profitability and alter consumer price expectations.
·Private labels and preferred sellers create potential platform-neutrality concerns when a platform is both intermediary and competitor.
·Data access is strategically important because transaction, demand and geography data can influence recommendations, product decisions and competition.
·CCI recommended greater transparency around ranking parameters, data collection/use/sharing, reviews and ratings, contract changes and discount policies.
20. CCI Findings: Marketplace Ranking
Pages 15–16 of the CCI study show that sellers' access to customers depends partly on marketplace search ranking. Marketplace respondents identified advertising, click-through rate, customer rating and conversion rate among relevant ranking factors; sellers additionally highlighted price, seller recognition, delivery speed and conversion.
Ranking/visibility factor identified in CCI study |
Business implication |
Advertising |
Paid visibility can accelerate discovery |
CTR |
Listing title, image, price and relevance affect clicks |
Customer ratings |
Trust and social proof influence visibility/conversion |
Conversion rate |
Poor conversion can make paid traffic inefficient |
Price |
Competitive pricing can affect both conversion and marketplace positioning |
Delivery speed |
Operational execution can influence marketplace performance |
Seller recognition |
Trust badges/assurance can matter |
21. Platform Dependence: The Hidden Business Risk
The CCI study found that many businesses considered presence on major platforms important to compete effectively, creating dependence on intermediaries. For a brand, the strategic answer is not necessarily to avoid marketplaces; it is to avoid having the entire customer acquisition engine controlled by one platform.
·Maintain a marketplace portfolio where category economics permit.
·Build an owned website and CRM.
·Invest in brand search and organic demand.
·Collect lawful first-party customer data with appropriate consent and privacy controls.
·Build repeat purchase programmes.
·Track channel-level profitability rather than only revenue.
22. E-commerce Opportunity by Business Type
Business type |
Opportunity |
Entry barrier |
Consumer brand |
D2C + marketplace + quick commerce |
Medium |
Manufacturer |
D2C, marketplace, B2B digital wholesale |
Medium |
Local retailer |
Hyperlocal, WhatsApp, ONDC, marketplace |
Low–medium |
B2B supplier |
Digital catalogue + RFQ + procurement |
Medium |
Logistics company |
3PL, fulfilment, reverse logistics |
Medium–high |
Warehouse operator |
Regional fulfilment / dark stores |
High |
SaaS company |
Seller analytics, CRM, inventory, ads, cataloguing |
Medium |
Marketing agency |
Marketplace management + D2C growth |
Low |
Creator/influencer |
Affiliate/social commerce |
Low |
Fintech |
Payments, credit, reconciliation |
High / regulated |
23. Attractive E-commerce Niches for New Businesses
·Regional and vernacular products
·Specialised food and wellness products
·Private-label home and personal-care products
·B2B industrial supplies
·MSME procurement marketplaces
·Auto and aftermarket parts
·Pet products
·Beauty and personal care
·Value fashion and accessories
·Regional handicrafts / ODOP products
·Business software for marketplace sellers
·Fulfilment, returns and logistics technology
·Data and analytics tools for e-commerce businesses
24. What Makes an E-commerce Business Profitable?
Driver |
Target mindset |
Gross margin |
High enough to absorb fulfilment, returns and acquisition costs |
AOV |
Increase through bundles, cross-sell and premium variants |
Repeat purchase |
Build CRM and product habit |
CAC |
Measure by channel and cohort |
Contribution margin |
Positive after variable fulfilment and marketing costs |
Inventory turns |
Avoid capital being trapped in slow-moving stock |
Return rate |
Reduce through accurate sizing, product information and quality |
Organic share |
Increase to reduce paid-media dependence |
Brand/direct traffic |
Build pricing power and customer ownership |
Channel diversification |
Reduce dependence on one marketplace |
25. Five-Year Business-Building Roadmap
Stage |
0–6 months |
6–18 months |
18–36 months |
36–60 months |
Product |
Validate 5–20 SKUs |
Expand winners |
Private label / new categories |
Portfolio expansion |
Channel |
Marketplace + D2C |
Add social/quick commerce |
B2B/exports |
Omnichannel |
Marketing |
Performance + SEO |
CRM + creators |
Brand building |
Organic/direct demand |
Operations |
3PL |
Regional stock |
Warehousing |
Network optimization |
Technology |
Store + analytics |
CRM/automation |
AI/personalisation |
Integrated commerce stack |
Finance |
Unit economics |
Contribution positive |
Scale with discipline |
Profit + strategic expansion |
26. Key KPIs to Track
Area |
KPIs |
Demand |
Sessions, impressions, search demand, shopper growth |
Conversion |
CVR, add-to-cart rate, checkout completion |
Revenue |
GMV, net sales, AOV, revenue per visitor |
Acquisition |
CAC, ROAS, MER, new customer share |
Retention |
Repeat rate, cohort revenue, LTV |
Product |
Gross margin, contribution margin, SKU velocity |
Inventory |
Stock cover, inventory turns, dead stock |
Operations |
Order-to-ship time, delivery SLA, cancellation rate |
Returns |
Return/refund rate, return reasons, net return cost |
Marketplace |
Ranking, ratings, ad spend, platform fees, contribution |
Finance |
Cash conversion cycle, working capital, EBITDA, free cash flow |
27. Major Risks
·Customer acquisition cost inflation
·Marketplace fee and policy changes
·Heavy discount dependence
·Low contribution despite high GMV
·Inventory obsolescence or overstock
·High return/refund rates
·Fraud and payment risk
·Counterfeit products and brand leakage
·Data/privacy and cybersecurity risk
·Platform concentration
·Logistics cost inflation
·Regulatory changes
·Cash-flow pressure caused by rapid growth
28. Investment & Business Opportunity Assessment
India's e-commerce opportunity is attractive because multiple growth engines are operating simultaneously: expanding online shoppers, Tier-2/3 adoption, quick commerce, D2C, B2B digital procurement, digital payments, logistics and AI. The most attractive opportunities are not necessarily another general marketplace; they are often infrastructure or vertical businesses that solve a specific commerce problem.
Opportunity |
Attractiveness |
Why |
Vertical D2C brand |
High |
Can build differentiated product + customer asset |
B2B niche marketplace |
High |
Large offline markets remain fragmented |
Seller SaaS/analytics |
High |
Recurring revenue + rising complexity |
Fulfilment/returns tech |
High |
E-commerce growth creates operational demand |
Quick-commerce enabler |
High |
Rapid segment growth but operationally demanding |
Generic marketplace |
Low–medium |
Requires enormous network effects and capital |
Pure discount-led brand |
Low |
Weak long-term economics |
Single-marketplace seller |
Medium |
Fast entry but high platform dependence |
29. Practical Strategy for a New E-commerce Venture
1.Choose a narrow category with repeat demand or high gross margin.
2.Validate 20–50 SKUs rather than launching hundreds of products.
3.Build a unit economics sheet before scaling ads.
4.Use marketplaces for demand discovery while building owned demand in parallel.
5.Measure contribution after shipping, returns, fees and marketing.
6.Invest early in product reviews, content and conversion rate optimisation.
7.Create CRM flows for first order, second order and win-back.
8.Use SEO to capture durable commercial demand.
9.Automate inventory and cash-flow reporting.
10.Expand geography only after proving product-market fit.
31. Conclusion
India's e-commerce market is entering a deeper phase of penetration. The first phase was about getting consumers online; the next phase is about getting more categories, more businesses and more transactions online—especially beyond the largest metros. Quick commerce, D2C, B2B commerce, regional commerce, digital payments, logistics and AI are reshaping the market.
For entrepreneurs, the strongest opportunity is to build around a specific economic advantage: better product, better procurement, lower fulfilment cost, higher repeat rate, better discovery, better seller software or a differentiated niche. The market is large, but scale without contribution margin can destroy value.
Important methodology note: Market-size estimates cited in this report are not interchangeable. Different sources measure broad e-commerce, e-retail, online retail or GMV using different base years and methodologies. Where the source did not support a number, no number has been invented. Business-model calculations are illustrative examples for understanding unit economics, not forecasts or investment guarantees.