Executive Summary
Chikankari can be profitable when a business combines authentic craftsmanship, dependable sourcing, a clear target customer, disciplined inventory and sound contribution margins. The strongest opportunity is often to build a differentiated brand—not compete only on the lowest price. However, there is no reliable current public figure in the sources reviewed that isolates the total national Chikankari market. India’s handicraft exports and embroidered-goods exports provide useful context, but they must not be described as Chikankari market size.
·India’s handicraft exports, excluding hand-knotted carpets, reached ₹33,122.79 crore in FY 2024–25, compared with ₹20,082.53 crore in FY 2014–15.
·The broader embroidered and crocheted goods export category was ₹4,350 crore in FY 2024–25; this category includes products beyond Chikankari.
·A 2025 Lucknow-focused study reports cotton as the most-used fabric in the Chikankari products covered by the study (70.9%). This is a study finding, not a nationwide sales-share estimate.
·A March 2026 PIB artisan profile reports earnings of ₹1,200–₹1,500 per finished product for artisans in one local setup. This is a case example, not a universal wage or average.
·An illustrative ₹1,499 kurti model generates ₹459 contribution per order (30.6%) before fixed overhead and taxes. Actual economics must be tested with supplier quotes and real sales data.
1. What Makes Chikankari a Business Opportunity?
Chikankari is a hand-embroidery tradition associated with Lucknow. Commercial products include kurtis, kurta sets, sarees, dupattas, shirts, co-ord sets, occasionwear and selected home-textile products. Its commercial appeal comes from the combination of visible craft, lightweight fabrics, versatile styling and the possibility of serving both everyday and premium fashion segments.
The business can be structured in several ways: reselling sourced garments, launching a private-label brand, coordinating an artisan network, supplying boutiques and retailers, or developing an export-focused collection. Each model has a different balance of capital, control, margin, operational complexity and quality risk.
2. Market Data: What the Numbers Actually Tell Us
The strongest official indicators available are for India’s broader handicrafts and embroidered-goods categories. These indicators show an established export ecosystem, but they do not reveal the standalone value of Chikankari sales in India.
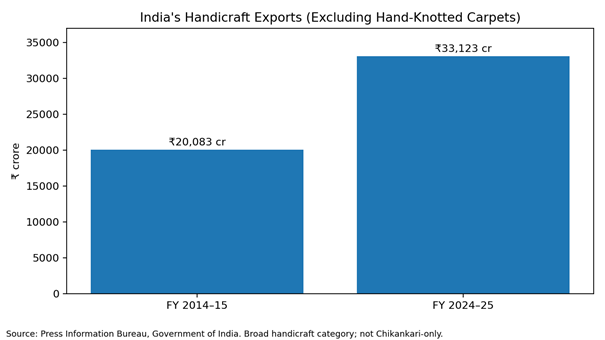
Figure 1. India’s handicraft exports (excluding hand-knotted carpets) increased from ₹20,082.53 crore in FY 2014–15 to ₹33,122.79 crore in FY 2024–25. That is an increase of approximately 64.9% over the period, equivalent to roughly 5.1% annualized growth. The figures cover the broad handicrafts category, not Chikankari alone.
Key market indicators
Indicator |
Reported figure |
How to interpret it |
Handicraft exports, FY 2014–15 |
₹20,082.53 crore |
Broad category, excluding hand-knotted carpets |
Handicraft exports, FY 2024–25 |
₹33,122.79 crore |
Broad category, not Chikankari-specific |
Embroidered and crocheted goods exports, FY 2024–25 |
₹4,350 crore |
Broader export category; includes products beyond Chikankari |
Cotton share in Chikankari products in one Lucknow-focused study |
70.9% |
Study-specific finding; not a national market share |
Artisan earnings in one PIB profile |
₹1,200–₹1,500 per finished product |
Reported case example, not a universal rate |
Is the Chikankari market worth ₹2,000 crore or more?
Older secondary articles and local estimates have cited large turnover figures for the Lucknow Chikankari ecosystem. Such figures should not be presented as a verified current national market size unless their methodology, year, geographic coverage and definitions are confirmed. For a credible business plan, describe them as historical or secondary estimates and avoid treating them as audited industry data.
3. Who Can Make Money in Chikankari?
Online reseller
Buys finished stock and sells through marketplaces, social media or a small website.
Potential advantage: Lower setup complexity; fast market testing.
Main risk: Price competition, platform fees and returns can erode margins.
Private-label brand
Sources garments or fabric, defines designs, packaging and brand positioning.
Potential advantage: More control over assortment, price and customer experience.
Main risk: Requires working capital, consistent quality and marketing.
Artisan-linked production
Works with embroiderers or a local production group to create controlled collections.
Potential advantage: Craft traceability, product differentiation and potential premium positioning.
Main risk: Quality control, production planning and fair payment management.
B2B wholesaler
Supplies boutiques, resellers and regional retailers.
Potential advantage: Potential repeat orders and larger volumes.
Main risk: Lower per-piece margin, credit risk and dependence on buyers.
Export-oriented label
Develops collections for overseas boutiques or online customers.
Potential advantage: Access to higher-value niches and international buyers.
Main risk: Compliance, shipping, returns, sizing and market-entry costs.
4. Startup Costs: Three Illustrative Budgets
The following are planning examples, not verified market averages. Actual budgets depend on whether the founder keeps inventory, produces garments, uses made-to-order fulfilment, rents premises or sells only online.
Lean online test: ₹50,000
Cost head |
Illustrative amount |
Initial samples and testing |
₹8,000 |
Opening inventory |
₹20,000 |
Packaging and labels |
₹4,000 |
Product photography/content |
₹5,000 |
Initial advertising |
₹8,000 |
Contingency |
₹5,000 |
Budget is indicative. Obtain current supplier, rent, logistics and platform quotes before committing funds.
Small private-label launch: ₹140,000
Cost head |
Illustrative amount |
Samples and product development |
₹15,000 |
Opening inventory |
₹55,000 |
Packaging and labels |
₹8,000 |
Photography and website setup |
₹15,000 |
Launch marketing |
₹25,000 |
Returns/working-capital reserve |
₹22,000 |
Budget is indicative. Obtain current supplier, rent, logistics and platform quotes before committing funds.
Small studio or boutique: ₹275,000
Cost head |
Illustrative amount |
Deposit and basic fit-out |
₹60,000 |
Opening inventory |
₹100,000 |
Fixtures and equipment |
₹25,000 |
Branding and launch content |
₹15,000 |
Launch marketing |
₹25,000 |
Working-capital reserve |
₹50,000 |
Budget is indicative. Obtain current supplier, rent, logistics and platform quotes before committing funds.
5. Product-Level Profitability: Example of a ₹1,499 Kurti
A high selling price does not automatically mean high profit. The business should calculate contribution after all variable costs associated with an order, then subtract fixed overheads.
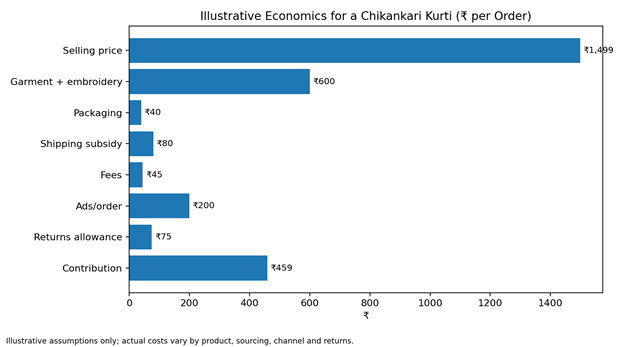
Illustrative calculation per successfully retained order:
Line item |
Amount |
Selling price |
₹1,499 |
Garment and embroidery cost |
-₹600 |
Packaging |
-₹40 |
Shipping subsidy |
-₹80 |
Payment/selling fees |
-₹45 |
Advertising cost per order |
-₹200 |
Returns/defects allowance |
-₹75 |
Contribution before fixed overhead and taxes |
₹459 |
Contribution margin = ₹459 ÷ ₹1,499 = approximately 30.6%. This is not net profit. It excludes fixed salaries, rent, software, accounting, interest, taxes and any other overhead not listed.
Break-even calculation
If monthly fixed costs are ₹30,000 and contribution is ₹459 per order, break-even volume is ₹30,000 ÷ ₹459 = 65.36, or about 66 retained orders per month. At 100 such orders, contribution after ₹30,000 fixed costs would be about ₹15,900 before taxes and unlisted costs. This is a scenario, not a forecast.
6. How Sensitive Is Profit to Costs?
Use scenarios before scaling. In the example above, a higher advertising cost or return rate can reduce contribution quickly. For example, if advertising cost per order rises from ₹200 to ₹350, contribution falls from ₹459 to ₹309. At ₹30,000 fixed costs, break-even then rises to about 98 retained orders per month. If the product costs or return rate are uncertain, test a small batch first.
Scenario |
Contribution/order |
Margin on ₹1,499 |
Break-even at ₹30,000 fixed cost |
Base case |
₹459 |
30.6% |
66 orders |
Ads increase to ₹350/order |
₹309 |
20.6% |
98 orders |
Garment cost increases by ₹100 |
₹359 |
23.9% |
84 orders |
Both changes occur |
₹209 |
13.9% |
144 orders |
7. Which Products Should a New Brand Test?
·Everyday cotton kurtis: a useful starting point for testing fit, fabric comfort and repeat demand.
·Kurta sets: higher order value potential, but more size, matching and inventory complexity.
·Dupattas: a way to test craft and colour preferences with less garment sizing complexity.
·Shirts and contemporary fusion wear: potentially useful for customers who want craft in modern silhouettes.
·Premium hand-embroidered pieces: suitable for story-led positioning if craftsmanship, finishing and provenance are verifiable.
·Made-to-order or limited drops: can reduce dead stock, although lead times and customer communication need careful management.
8. Sourcing and Quality Control
A Chikankari brand’s reputation depends on consistency. Before placing a large order, obtain samples from multiple suppliers and check the base fabric, embroidery density, stitch consistency, thread quality, finishing, colourfastness, shrinkage, seam strength and measurements after washing.
·Ask suppliers to separate fabric, stitching, embroidery, finishing and packaging costs where possible.
·Clarify whether work is hand embroidery, machine embroidery or a combination, and describe it accurately to customers.
·Agree on sample approval, acceptable defect rate, rework responsibility, lead time, payment terms and delivery schedule in writing.
·Maintain batch-level records and photograph approved samples.
·Pay artisans on clear, timely terms and avoid promising a craft story that cannot be substantiated.
9. Marketing Channels and Growth Opportunities
Instagram and short-form video
Show embroidery details, fabric movement, styling and the making process. Use clear product tags and track clicks, enquiries and paid orders—not views alone.
Own website
Build product pages with close-up images, size charts, fabric/care instructions, dispatch timelines, return policy and authenticity details.
Marketplaces
Use marketplaces to test demand, while including commissions, fulfilment charges, discounting and returns in contribution calculations.
WhatsApp and repeat buyers
Use opt-in customer lists for launches, restocks and styling suggestions; keep consent and opt-out practices clear.
Boutique and B2B supply
Prepare a line sheet with wholesale prices, minimum order quantities, lead times and clear product specifications.
International niche markets
Research buyer requirements, shipping economics, duties, returns, labelling and payment terms before exporting.
10. 90-Day Action Plan
Days 1–15: Validate
Choose one customer segment, interview potential buyers, compare suppliers, order samples and estimate landed cost.
Days 16–30: Build the test collection
Select 5–10 designs, document size and quality standards, photograph products and prepare policies.
Days 31–45: Launch small
Sell a limited batch through one or two channels; track visits, enquiries, conversion, cancellations, returns and contribution.
Days 46–60: Improve
Remove weak products, fix sizing/quality issues, test bundles and price points, and negotiate supplier improvements.
Days 61–90: Scale cautiously
Reorder proven designs, add repeat-customer campaigns, test B2B leads or new channels only if contribution and fulfilment are healthy.
11. KPIs Every Chikankari Business Should Track
·Gross margin and contribution margin by SKU and channel
·Customer acquisition cost (CAC) and contribution after advertising
·Conversion rate, average order value and repeat purchase rate
·Return, exchange, cancellation and defect rates
·Inventory sell-through, ageing stock and cash tied up in inventory
·Supplier on-time delivery and first-pass quality rate
·Artisan lead times, payment timeliness and rework rates
12. Risks That Can Make the Business Unprofitable
·Buying too much stock before product-market fit is demonstrated.
·Competing only on price against mass-produced or machine-embroidered products.
·Underestimating returns, size exchanges, marketplace fees and discounting.
·Inconsistent embroidery, fabric shrinkage or colour variation across batches.
·Depending on one supplier or one sales channel.
·Calling machine work hand embroidery or making unsupported claims about origin and artisan impact.
·Treating broad handicraft export statistics as proof of Chikankari-specific demand.
13. Conclusion: Is Chikankari Profitable?
Yes, Chikankari can be profitable—but profitability is a business-model outcome, not a guaranteed feature of the craft. A small online seller can begin with a controlled test collection; a private-label brand can differentiate through design, fit and reliable quality; and an artisan-linked business can build value through traceable craftsmanship and fair, consistent production.
The data supports the existence of a substantial Indian handicrafts export ecosystem and a broader embroidered-goods export category. It does not, by itself, establish a verified current national Chikankari market size. The most defensible path is to validate demand with a small collection, calculate contribution after all variable costs, and expand only when actual sell-through, return rates and cash flow support it.