1. Executive Summary
India’s bakery sector combines everyday consumption with premium, convenience, health-oriented and celebration-led demand. The supplied MoFPI sector profile reports an Indian bakery market of about USD 13.8 billion in 2024 and projects around USD 31.5 billion by 2033 at a 9.12% CAGR. It identifies biscuits, breads, cakes, pastries, cookies, pizzas, puffs, donuts, muffins, croissants, bagels, buns and rolls as important opportunity areas.
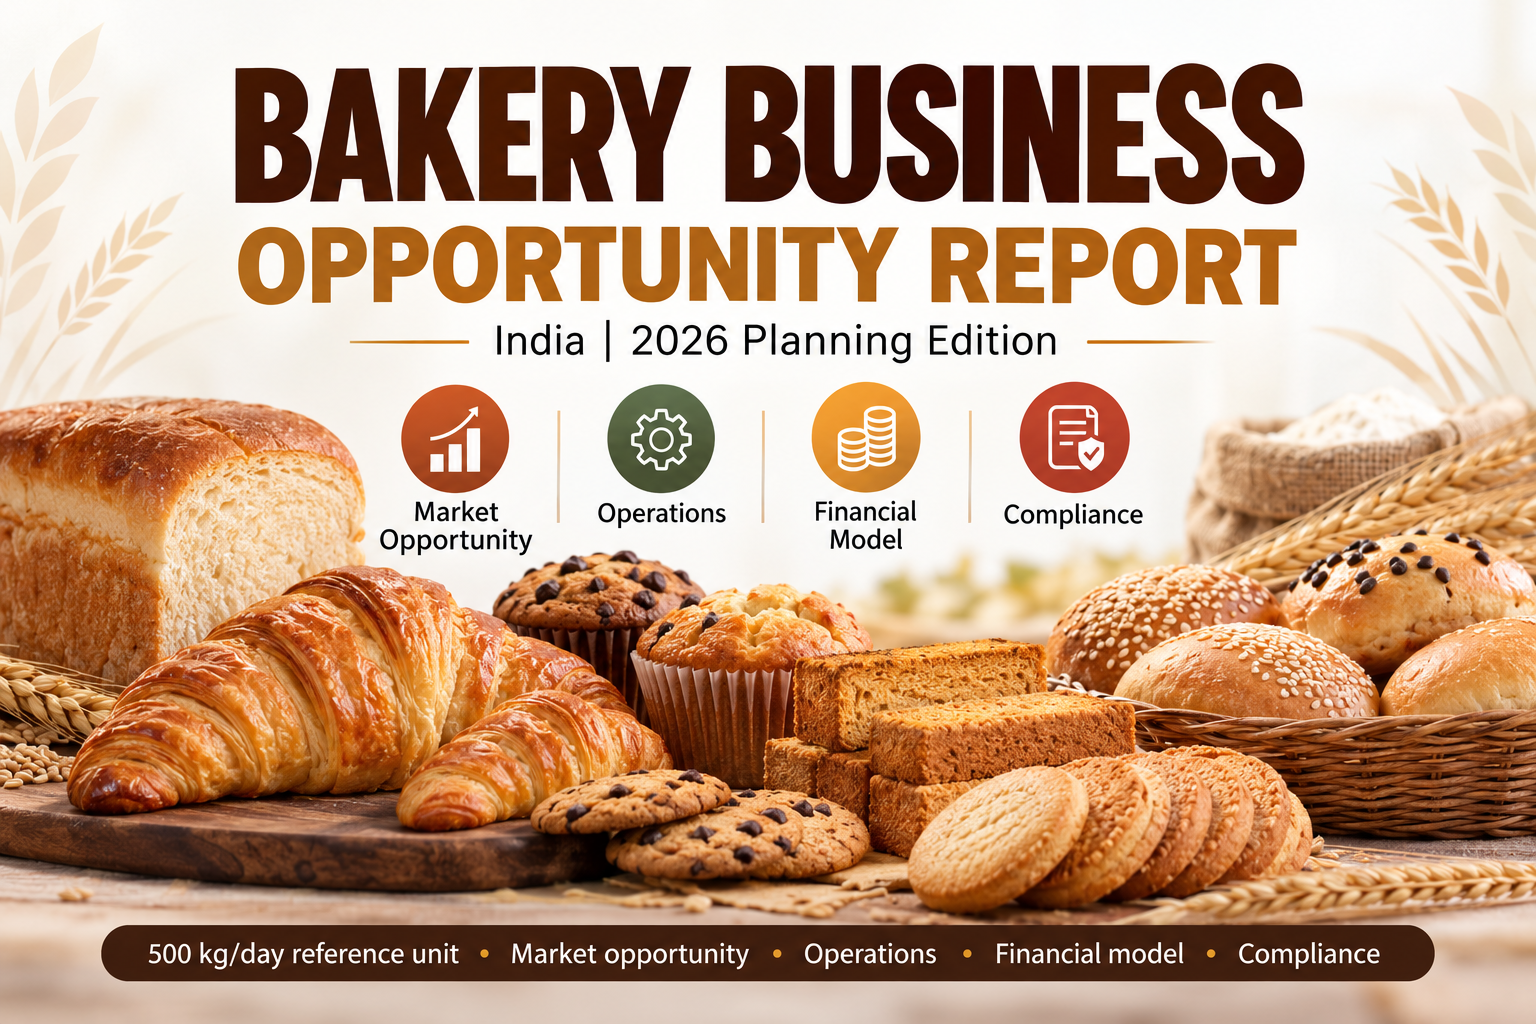
The supplied sample report uses a 500 kg/day installed-capacity unit, 300 working days, 80% efficiency, and a product mix of 20% khari, 40% rusk and 40% atta biscuits. At its reference selling prices, full-capacity annual sales are approximately ₹1.536 crore. The source model ramps utilisation from 70% in Year 1 to 90% by Year 5 and reports IRR of 22% and average DSCR of 2.95.
The strongest 2026 strategy is not to copy a traditional bakery blindly. A better model combines a focused core range, disciplined production, B2B institutional supply, local retail/distribution, selected D2C channels and premium/health SKUs. The 500 kg/day model should be treated as a benchmark; current vendor quotations and local operating costs must drive the final investment decision.
2. Source Basis
·Primary source: supplied Business Opportunity Report on Establishment of a Bakery Unit by PACS. It covers project profile, business model, assumptions, process, machinery, manpower, projections, feasibility, SWOT, risks and financial ratios.
·Primary source: supplied MoFPI Bakery Sector Profile. It covers global trends, India market, trade, investment opportunities, government interventions and R&D/skills.
·Current regulatory information is supplemented only where necessary, especially FSSAI’s 2026 turnover thresholds and current MoFPI scheme pages.
·All financial numbers from the sample report are labelled as reference figures rather than current quotations.
3. Indian Bakery Market Opportunity
The sector profile says the Indian bakery market was approximately USD 13.8 billion in 2024 and is projected to reach around USD 31.5 billion by 2033 at a 9.12% CAGR. Growth is linked to population, income, urbanisation, western food influence, convenience, ready-to-eat consumption, cloud kitchens, organised retail and e-commerce.
Exports are another opportunity. The profile reports approximately USD 611.32 million of Indian HS 1905 bakery exports in 2024; sweet biscuits contributed USD 349.01 million or 57% of bakery exports, followed by other bakers’ wares at 33%, waffles/wafers at 5% and rusks/toasted products at 4%.
Indicator |
Source figure |
Implication |
Indian bakery market, 2024 |
~USD 13.8 bn |
Large domestic demand base |
Projected market, 2033 |
~USD 31.5 bn |
Long-term expansion |
Reported CAGR |
9.12% |
Supports capacity planning |
Bakery exports, 2024 |
~USD 611.32 mn |
Export opportunity |
Sweet biscuit share of exports |
57% |
Strong scalable category |
4. Why Bakery Is Attractive
·High purchase frequency for bread, buns, rusks, biscuits and snacks.
Multiple price points allow value, core and premium SKUs.
Local bakeries can compete on freshness and customisation.
Institutional buyers can create recurring B2B demand.
Health-led products such as whole-wheat, multigrain and fortified bakery create differentiation.
D2C and e-commerce can expand reach beyond the physical outlet.
Shelf-stable packaged bakery products are easier to distribute geographically than highly perishable products.
5. Business Models
Model |
Products |
Customers |
Advantage |
Risk |
Retail bakery |
Bread, cakes, pastries, puffs |
Local households |
Higher retail value |
Rent + perishability |
Manufacturing + distribution |
Biscuits, rusk, khari, bread |
Retailers/distributors |
Scalable volume |
Working capital |
Institutional B2B |
Buns, rolls, bread, pastries |
QSRs, cafés, hotels |
Repeat orders |
Concentration |
D2C/online |
Cakes, cookies, premium packs |
Urban consumers |
Brand control |
Delivery/CAC |
Health bakery |
Multigrain, whole wheat, reduced sugar |
Health-conscious buyers |
Premium positioning |
Formulation discipline |
Private label |
Biscuits/cookies/rusk |
Retailers/brands |
Capacity utilisation |
Lower brand ownership |
6. Product Portfolio & Opportunity
The sample report concentrates on khari, rusk and atta biscuits, while the MoFPI sector profile identifies a much wider opportunity set.
Product cluster |
Role |
Channel fit |
Priority |
Biscuits/cookies |
Volume + brand |
Retail/distributor/D2C |
Very high |
Rusk |
Repeat + shelf stability |
Retail/distributor |
Very high |
Khari/puffs |
Tea-time/freshness |
Retail/D2C |
High |
Bread/buns/rolls |
Daily + B2B |
Retail/QSR |
High |
Cakes/pastries |
Celebration/premium |
Retail/D2C |
High |
Muffins/donuts/croissants |
Urban convenience |
Café/QSR/D2C |
Growing |
Health bakery |
Differentiation |
D2C/modern retail |
Strategic |
The sector profile explicitly lists biscuits, bread, cakes, pastries, cookies, pizzas, puffs, donuts, muffins, croissants, bagels, buns and rolls as high-potential products.
7. Target Customers & Channels
·Households within the fresh-delivery radius.
·Kirana and neighbourhood stores for packaged products.
·Supermarkets and modern retail.
·Cafés, QSRs and restaurants for buns, rolls and pizza bases.
·Hotels, caterers, offices and institutions for bulk supply.
·Online customers for cakes, premium cookies, health products and festive boxes.
·Regional distributors for nearby towns and semi-urban markets.
8. Location & Plant Strategy
·Choose manufacturing location for utilities, labour, raw materials and road access—not only footfall.
·Separate raw material, production, cooling, packing and finished-goods zones.
·Provide reliable power, water, drainage and ventilation.
·Fresh bakery needs dense delivery routes; packaged bakery needs distributor and transport access.
·Plan loading/unloading and waste movement without crossing clean production zones.
9. Technical Project Concept – 500 kg/day
The sample report assumes one 8-hour shift, 300 working days per year and 80% efficiency. First-year utilisation is 70%, rising to 90% by Year 5.
Parameter |
Reference assumption |
Installed capacity |
500 kg/day |
Effective output at 80% efficiency |
400 kg/day |
Working days |
300/year |
Effective annual output |
120,000 kg/year |
Mix |
20% khari; 40% rusk; 40% atta biscuits |
Reference prices |
₹100/kg; ₹120/kg; ₹150/kg |
Full-capacity sales |
₹1.536 crore/year |
Utilisation path |
70%, 75%, 80%, 85%, 90%, 90% |
10. Manufacturing Process
For khari, the source describes weighing, kneading, sheeting, layering with ghee, chilling, cutting, baking, cooling and packing. Rusk follows mixing, moulding, proofing, first baking, cooling, second baking, cooling and packing. Atta biscuits involve dough preparation, shaping/decorating, baking and cooling.
·Raw-material receipt and inspection
·Batch weighing/formulation
·Mixing/kneading
·Dividing/sheeting/moulding
·Proofing/fermentation where applicable
·Baking
·Cooling
·Quality inspection
·Packing/coding
·Finished-goods storage and dispatch
The supplied process-flow diagram shows pre-mixing → mixing → dividing → dough moulding → fermentation/proofing where applicable → baking → cooling → packing.
11. Plant & Machinery – Reference Schedule
Equipment |
Qty. |
Sample amount |
Purpose |
Baking ovens |
4 |
₹5.00 lakh |
Baking |
Dough mixers |
2 |
₹2.00 lakh |
Dough |
Cutter/divider/sheeter |
3 |
₹9.00 lakh |
Forming |
Rusk machine |
1 |
₹1.00 lakh |
Rusk |
Sifter/pulveriser/grinder |
3 |
₹2.40 lakh |
Ingredient prep |
Trays/bins/tools |
1 lot |
₹0.60 lakh |
Handling |
Packing equipment |
2 |
₹6.00 lakh |
Packing |
Misc./RO/flour mill |
— |
₹15.00 lakh |
Utilities/support |
Total machinery |
— |
₹40.00 lakh |
Reference total |
The source notes that machinery rates may vary by market. Current supplier quotations should therefore replace these benchmark figures before financing.
12. Raw Materials & Working Capital – Source Benchmark
Material |
Annual quantity |
Sample annual amount |
Maida/atta |
120 MT |
Own assumption |
Ghee |
55 MT |
₹55.00 lakh |
Edible oil |
7 MT |
₹8.40 lakh |
Sugar |
4 MT |
₹1.20 lakh |
Salt |
2 MT |
₹0.20 lakh |
Other ingredients |
6 MT |
₹6.00 lakh |
Packaging |
— |
₹2.40 lakh |
Total |
— |
₹73.20 lakh |
These are source-report assumptions, not 2026 quotations.
13. Manpower Plan
Role |
Heads |
Annual cost in sample |
Function |
Technical staff |
3 |
₹4.32 lakh |
Production/quality |
Administration |
3 |
₹4.32 lakh |
Accounts/procurement |
Marketing |
6 |
₹7.20 lakh |
Retail/B2B |
Labour |
10 |
₹9.60 lakh |
Production/packing |
Total |
22 |
₹25.44 lakh |
— |
14. Project Cost – Source Benchmark
Head |
Amount |
Land |
Own |
Building |
Own |
Plant & machinery |
₹40.00 lakh |
Contingency |
₹8.00 lakh |
Other capital investment |
₹12.00 lakh |
Total project cost |
₹60.00 lakh |
A major limitation of this benchmark is that land and building are assumed to be owned. A new entrepreneur who buys or leases premises must add acquisition/lease, civil work, utilities, deposits and fit-out costs.
15. Reference Financing Structure
Funding source |
Sample amount |
Share |
Promoter capital |
₹30.00 lakh |
50.0% |
NCDC loan |
₹20.00 lakh |
33.3% |
MoFPI subsidy shown in sample |
₹10.00 lakh |
16.7% |
Total |
₹60.00 lakh |
100% |
The subsidy/loan structure is specific to the supplied sample. It should not be assumed to be available to every 2026 entrepreneur. Verify current scheme notifications and eligibility before putting any subsidy into a bank cash-flow projection.
16. Six-Year Reference Financial Projection
Year |
CU |
Sales |
Raw material |
Net profit |
Net margin |
Year 1 |
70% |
₹107.52 L |
₹58.56 L |
₹-15.11 L |
-14.1% |
Year 2 |
75% |
₹115.20 L |
₹65.88 L |
₹-12.14 L |
-10.5% |
Year 3 |
80% |
₹122.88 L |
₹73.20 L |
₹-9.18 L |
-7.5% |
Year 4 |
85% |
₹130.56 L |
₹73.20 L |
₹0.38 L |
0.3% |
Year 5 |
90% |
₹138.24 L |
₹73.20 L |
₹9.93 L |
7.2% |
Year 6 |
90% |
₹138.24 L |
₹73.20 L |
₹13.27 L |
9.6% |
The source cash-flow table reports net profits of ₹2.89 lakh, ₹2.86 lakh, ₹2.82 lakh, ₹9.38 lakh, ₹15.93 lakh and ₹16.27 lakh across Years 1–6.
17. Financial Indicators & Interpretation
Indicator |
Reference result |
Meaning |
Full-capacity sales |
₹1.536 crore/year |
At effective 120,000 kg/year |
Year 1 sales |
₹1.0752 crore |
70% utilisation |
Year 5 sales |
₹1.3824 crore |
90% utilisation |
Six-year cumulative net profit |
~₹50.15 lakh |
Sum of source-model net profit |
Reported IRR |
22% |
Source report result |
Average DSCR |
2.95 |
Source report result |
Payback statement |
~5 years |
Source report assumption |
The source annexure calculates IRR at 22% and average DSCR at 2.95.
18. Break-Even & Sensitivity Framework
The sample report does not provide a conventional contribution-margin break-even calculation. For a current bankable report, calculate break-even using current fixed costs, variable cost per kg, realised selling price, wastage, discounts and channel commissions.
Break-even quantity = Fixed operating costs ÷ (Average realised selling price/kg − Variable cost/kg)
·Track utilisation monthly.
·Track realised price/kg after discounts and channel commissions.
·Track ingredient cost/kg and packaging cost/kg.
·Track wastage, returns and expiry.
·Track B2B receivable days and distributor credit.
19. Sales & Marketing Strategy
19.1 Product architecture
Launch a narrow hero range rather than dozens of SKUs. A practical starting portfolio is rusk, biscuits/cookies, khari/puff and selected bread/bun lines, with one differentiated health or premium range.
19.2 Three price tiers
·Value packs for kirana and semi-urban markets.
·Core family packs for mainstream retail.
·Premium/health/custom packs for D2C and modern retail.
19.3 B2B capacity engine
Target cafés, QSRs, restaurants, caterers, hotels, hostels, offices and institutions. Use B2B contracts to improve plant utilisation while retail/D2C builds brand equity.
19.4 Digital engine
Use Google Business Profile/local SEO for the retail outlet, a simple ordering website, WhatsApp ordering, social content, and selected delivery/e-commerce channels. For packaged products, D2C and distributor partnerships can widen the geographic footprint.
19.5 Seasonal products
·Diwali: premium cookie boxes and corporate gifting.
·Christmas/New Year: plum cakes and gift packs.
·Wedding season: custom dessert/snack boxes.
·Regional festivals: local flavours and celebration products.
20. Government Support & 2026 Compliance
The supplied sector profile discusses PMKSY, PMFME and PLISFPI as major food-processing support mechanisms. It describes PMFME as a scheme for micro food-processing enterprises with credit-linked subsidy, capacity building and branding/marketing support, but its stated operating period was 2020-21 to 2025-26. Therefore, a 2026 applicant should verify current continuation/application windows rather than automatically include a PMFME subsidy in the report.
MoFPI continues to publish PMKSY/PLISFPI/PMFME information and 2026 notices, so the exact scheme and open EOI should be checked immediately before filing.
FSSAI’s 2026 reforms, effective 1 April 2026, raised the turnover threshold for registration to up to ₹1.5 crore; State License applies above ₹1.5 crore up to ₹50 crore; Central License applies above ₹50 crore. The reforms also introduced perpetual validity subject to compliance.
·FSSAI registration/licence through FoSCoS as applicable.
·GST compliance where applicable.
·Local municipal/trade permissions.
·Fire/building safety permissions where applicable.
·Pollution/waste permissions as applicable to scale and site.
·Food labelling, allergen, batch, date, net-quantity and packaging compliance.
·MSME/Udyam registration is advisable for formalisation and applicable benefits.
21. Quality & Food Safety System
·Approved supplier list and incoming inspection.
·Batch formulation and weighing controls.
·Water-quality controls; the source report recommends good-quality/RO water where source TDS is high.
·Time/temperature controls for baking and cooling.
·Cleaning and pest-control schedules.
·Raw/finished product segregation.
·Allergen/cross-contact controls where relevant.
·Packaging integrity and traceability.
·Immediate removal of waste and burnt/damaged products to reduce contamination risk.
22. Risk Assessment
Risk |
Impact |
Mitigation |
Ingredient inflation |
High |
Multiple suppliers + recipe engineering |
Low utilisation |
Very high |
B2B + distributors + D2C |
Perishability |
High |
Demand forecasting + batch sizing |
Large-brand competition |
High |
Freshness + niche + local distribution |
Quality inconsistency |
Very high |
SOPs + QC + training |
Credit sales |
Medium/high |
Credit limits + collection discipline |
Delivery cost |
Medium |
Cluster routes + minimum order value |
Regulatory failure |
Very high |
FSSAI system + audits |
Too many SKUs |
Medium |
ABC analysis + discontinue weak SKUs |
23. Implementation Schedule
Phase |
Indicative timing |
Activities |
Feasibility |
Weeks 1–3 |
Market survey, site, product mix, model |
report & finance |
Weeks 3–6 |
Quotations, promoter contribution, loan proposal |
Approvals/design |
Weeks 4–8 |
Licences, layout, utilities |
Procurement |
Weeks 7–12 |
Machinery and packaging equipment |
Installation |
Weeks 12–16 |
Installation and utilities |
Recruit/training |
Weeks 13–17 |
Baker, production, QC, sales |
Trial production |
Weeks 17–19 |
Recipes, QC, packaging |
Commercial launch |
Week 20 onward |
Retail/B2B launch and route expansion |
The source sample uses an approximately eight-month implementation sequence including approval, financing, machinery procurement, installation and trial production.
24. Training & Skill Ecosystem
The supplied sector profile identifies NIFTEM-Kundli, NIFTEM-T and CSIR-CFTRI among the important R&D and skill-development institutions for baked goods. NIFTEM-Kundli has a bakery unit for research, demonstrations and product development, while CSIR-CFTRI has R&D capability in flour milling, baking and confectionery technologies.
25. SWOT Analysis
Strengths |
Weaknesses |
Opportunities |
Threats |
Repeat demand |
Perishability |
Health products |
Large brands |
Multiple channels |
Skill dependency |
D2C/e-commerce |
Price competition |
Diversification |
Working capital |
B2B/QSR |
Input inflation |
Local freshness |
Consistency |
Premium products |
Technology changes |
Packaged scalability |
Distribution |
Exports/private label |
Food-safety failure |
26. Recommended Business Blueprint
Area |
Recommendation |
Factory |
500 kg/day reference scale; expand after demand proof |
Core products |
Rusk + biscuits/cookies + khari; add bread/buns where routes support it |
Premium layer |
Health cookies, multigrain/whole-wheat, premium boxes |
B2B |
Cafés, QSRs, restaurants, caterers, hotels, institutions |
Retail |
Kirana + supermarkets + distributors |
Digital |
WhatsApp + website/D2C + local SEO + selected platforms |
Positioning |
Fresh + hygienic + consistent + value; premium sub-range |
Expansion trigger |
Sustained high utilisation + verified orders before capacity addition |
27. Final Investment View
The bakery opportunity is structurally attractive because of repeat consumption, convenience demand, urbanisation, health-led innovation, organised retail, e-commerce and institutional foodservice. The MoFPI profile specifically highlights expansion in premium/artisanal products, convenience/snacking, health and wellness, fast-food supply, and online/direct-to-consumer sales.
The 500 kg/day source report demonstrates a workable reference manufacturing model, but its ₹60 lakh project cost, subsidy structure, wages and machinery rates should not be copied into a 2026 loan proposal without updating. The most important next step is a quotation-backed report with actual land/lease, civil work, machinery, utility, labour, ingredient, packaging, working-capital and financing assumptions.
28. Bank/Investor report Checklist
·Current machinery quotations from 2–3 suppliers.
·Land ownership/lease and building documents.
·Civil, electrical, utility and fire estimates.
·Current raw-material and packaging quotations.
·Local wage and staffing plan.
·Month-wise sales pipeline by channel.
·Working-capital and receivable assumptions.
·Bank loan term sheet and repayment schedule.
·Current subsidy/scheme notification and eligibility proof.
·FSSAI and local statutory plan.
·Promoter KYC/net-worth/contribution evidence.
·Projected P&L, balance sheet, cash flow, DSCR, IRR and sensitivity.