Introduction
India is a major manufacturing and trading hub for gems and jewellery, but market analysis becomes misleading when sector-wide jewellery figures are presented as gemstone-only demand. This article checks the uploaded research reports, separates actual historical observations from forecasts, and identifies what can be concluded about the opportunity—and what still requires dedicated coloured-gemstone sales data.
1. First, separate the markets
The CareEdge report dated 4 December 2024 estimates the Indian domestic jewellery market (gold and studded jewellery) at ₹4,976 billion in CY2023 and projects ₹11,044 billion by CY2032. This is a broad jewellery-market estimate, not the market size of loose coloured gemstones or gemstone ecommerce.
The GJEPC-supported NCAER cluster study (published October 2020, based on a 2019 survey) estimates 9.89 lakh gems-and-jewellery enterprises and reports 42.9 lakh workers in the sector. It maps manufacturing, trading and retail activity; it does not measure gemstone retail sales by stone type.
The 2025 ComFin Research paper analyses four specific jewellery customs categories from FY2013–14 to FY2022–23: gold jewellery set with pearls, gold jewellery set with diamonds, silver jewellery set with gems, and silver filigree work. It is not a comprehensive study of loose coloured-gemstone demand.
Table 1. What each source can and cannot support
Source |
Useful evidence |
Important limitation |
CareEdge, Dec 2024 |
Domestic jewellery market estimate/projection; overall G&J imports/exports; export destinations; adjacent jewellery segments. |
Broad jewellery categories; many figures are forecasts made in 2024, not later actual results. |
NCAER/GJEPC, Oct 2020 |
Enterprise counts, worker estimates, regional/segment clusters and supply-chain structure. |
Survey primarily from 2019; not current sales, revenue or consumer demand. |
ComFin Research, Jul 2025 |
Selected jewellery HS-code export/import trends for FY14–FY23. |
Four selected jewellery codes only; tables contain apparent transcription/formatting ambiguities; not gemstone-only market data. |
Advit Jewels prospectus, Jun 2026 |
One Kundan Polki jewellery company’s revenue, margins, B2B share, supplier concentration and inventory days. |
Company-specific; cannot be generalized to the entire gemstone or jewellery market. |
2. Domestic jewellery market: strong forecast, not a gemstone TAM
CareEdge reproduces a domestic jewellery-market series from IMARC Group. The reported series rises from ₹2,029 billion in CY2018 to ₹4,976 billion in CY2023. It then forecasts ₹5,610 billion for CY2024 and ₹11,044 billion for CY2032. The report states an expected 8.8% CAGR from CY2023 to CY2032. Since CY2024 onward are marked projections in the report, they must not be described as actuals without checking later releases.
The implication for a gemstone business is contextual: a large jewellery market can provide routes to market through jewellery makers, retailers and online brands, but it does not tell us what fraction of spend goes to loose rubies, sapphires, emeralds or other stones. A defensible gemstone TAM needs a narrower segment definition and bottom-up buyer evidence.
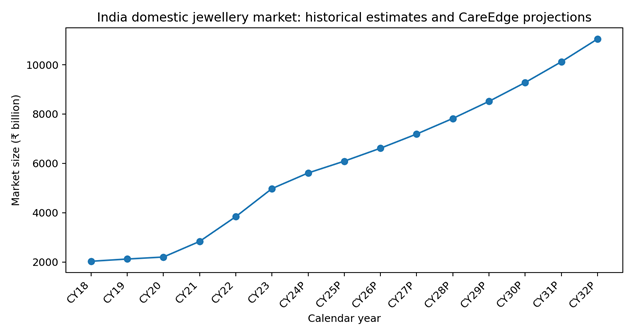
Figure 1. CareEdge/IMARC domestic jewellery market series. CY24P–CY32P are projections as printed in the December 2024 report.
Table 2. Domestic jewellery market series from CareEdge
Year |
Market size (₹ billion) |
Status in report |
CY18 |
2,029 |
Historical estimate |
CY19 |
2,120 |
Historical estimate |
CY20 |
2,201 |
Historical estimate |
CY21 |
2,834 |
Historical estimate |
CY22 |
3,838 |
Historical estimate |
CY23 |
4,976 |
Historical estimate |
CY24P |
5,610 |
Projection (P) |
CY25P |
6,089 |
Projection (P) |
CY26P |
6,614 |
Projection (P) |
CY27P |
7,189 |
Projection (P) |
CY28P |
7,821 |
Projection (P) |
CY29P |
8,515 |
Projection (P) |
CY30P |
9,278 |
Projection (P) |
CY31P |
10,119 |
Projection (P) |
CY32P |
11,044 |
Projection (P) |
3. India’s overall gems-and-jewellery trade: exports remain larger than imports in this series
CareEdge’s GJEPC-sourced chart reports exports above imports for each annual period shown from FY2019 to FY2024. Exports fall from ₹2.7 trillion in FY2019 to ₹1.9 trillion in FY2021, rebound to ₹3.0 trillion in FY2023 and ease to ₹2.65 trillion in FY2024. Imports show a similar cycle, reaching ₹2.1 trillion in FY2023 before easing to ₹1.84 trillion in FY2024.
This is evidence of a cyclical, export-oriented sector—not evidence that every gemstone category is growing. The report also shows Q1FY25 exports at ₹0.57 trillion versus ₹0.61 trillion in Q1FY24, while imports were ₹0.45 trillion versus ₹0.43 trillion. The quarter-on-quarter-year comparison indicates exports were lower and imports slightly higher in that specific quarter.
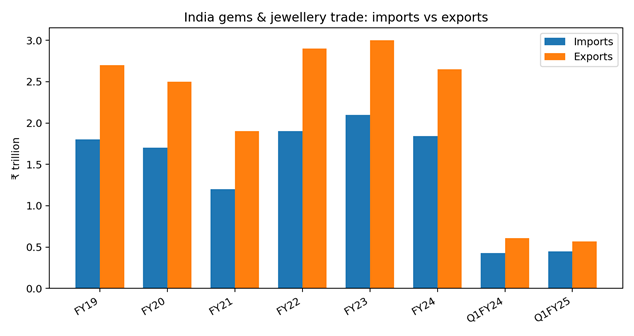
Figure 2. Overall gems-and-jewellery imports and exports from CareEdge’s GJEPC-sourced chart. Annual FY values and quarterly Q1 values are shown together; compare like periods only.
Table 3. Overall gems-and-jewellery trade
Period |
Imports (₹ trillion) |
Exports (₹ trillion) |
Exports less imports (₹ trillion) |
FY19 |
1.80 |
2.70 |
0.90 |
FY20 |
1.70 |
2.50 |
0.80 |
FY21 |
1.20 |
1.90 |
0.70 |
FY22 |
1.90 |
2.90 |
1.00 |
FY23 |
2.10 |
3.00 |
0.90 |
FY24 |
1.84 |
2.65 |
0.81 |
Q1FY24 |
0.43 |
0.61 |
0.18 |
Q1FY25 |
0.45 |
0.57 |
0.12 |
4. Export destination concentration
CareEdge reports the United States as the largest destination in FY2024, with 30.4% of overall Indian gems-and-jewellery exports. The Middle East accounted for 26.5%, Hong Kong 20.9%, Belgium 6.1%, Israel 2.2%, Switzerland 2.1% and other countries 11.8%. These are sector-wide export destinations, not coloured-gemstone-specific destination shares.
For a supplier or exporter, destination concentration is a prompt to investigate product-specific buyer standards, tariffs, customer concentration and payment terms. It is not a guarantee that a particular gemstone has equivalent demand in those markets.
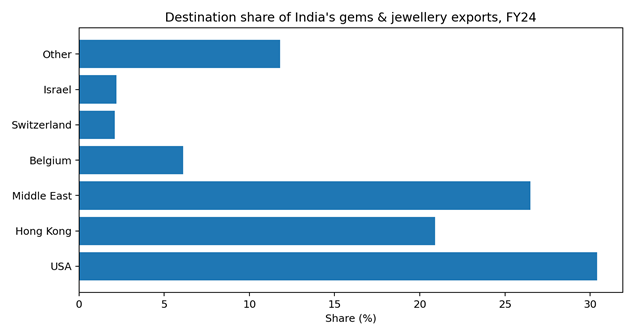
Figure 3. Export destination shares for overall Indian gems and jewellery in FY2024, as reported by CareEdge/GJEPC.
Table 4. FY2024 destination shares
Destination |
Share of overall G&J exports |
USA |
30.4% |
Hong Kong |
20.9% |
Middle East |
26.5% |
Belgium |
6.1% |
Switzerland |
2.1% |
Israel |
2.2% |
Other |
11.8% |
5. Audit findings: data that should not be copied uncritically
The ComFin Research paper’s tables are explicitly in ₹ lakh and use four selected HS codes. In the gold table, at least one number is visibly malformed in the parsed table (for example, “2,,22,598.96”), and the paper’s narrative contains claims about export/import behaviour that are not uniformly supported by every row. The paper also uses a limited commodity sample. Before reusing its reported means or CAGR, the underlying TradeStat records should be downloaded and recalculated.
CareEdge’s 2024 projections are labelled CY24P onward. They are useful as a dated forecast but should not be presented as current actual market size. NCAER’s cluster counts are from a 2019 survey published in 2020; they are useful for understanding structure and geography, not for claiming current 2026 enterprise counts.
Advit Jewels’ prospectus is an issuer disclosure and useful as a case study of one Kundan Polki manufacturer. Its revenue growth and inventory metrics are not industry averages and its products include gold, diamond polki, gemstones and jewellery craftsmanship.
Table 5. Evidence quality checklist
Claim you may want to make |
Verdict |
Safer treatment |
“India’s jewellery market is ₹4,976 billion” |
Supported for CY2023 in CareEdge report scope. |
State the year, source and that this is broad domestic jewellery, not gemstone-only. |
“India’s jewellery market will be ₹11,044 billion in 2032” |
Forecast in a Dec 2024 report, not an assured outcome. |
Write “CareEdge/IMARC projected…” and date the forecast. |
“NCAER found 9.89 lakh G&J enterprises” |
Supported by 2019 survey reported in 2020. |
Label as historical survey estimate, not current count. |
“These files prove which gemstone sells most in India” |
Not supported. |
Need stone-level sales/marketplace transaction data or a transparent primary study. |
“Advit Jewels’ margins are industry averages” |
Not supported. |
Use only as one company case study. |
Sources and methodology
Figures are presented with their reporting period and category scope. Export data measures cross-border trade, not domestic consumer sales. Where the source does not support a point, the article states the limitation rather than inventing a ranking.
·Sathish & Venkatesh (2025), “Export and Import Dynamics of Gems and Jewellery: A Trend Analysis,” ComFin Research, 13(3), pp. 26–32. User-uploaded PDF, published online 1 July 2025; uses TradeStat data for FY2013–14 to FY2022–23. — DOI: https://doi.org/10.34293/commerce.v13i3.9187
·CareEdge Research, Industry Research Report on Indian Gems and Jewellery Sector, dated 4 December 2024. User-uploaded PDF. Figures include estimates and projections attributed to IMARC/GJEPC. — Report date: 4 December 2024
·NCAER, Cluster Mapping Study of the Gems & Jewellery Sector in India, October 2020; survey data largely from 2019. User-uploaded PDF. — https://www.ncaer.org/
·Advit Jewels Limited Prospectus, dated 27 June 2026. User-uploaded PDF. Company-level figures, not industry averages. — Company website listed in prospectus: https://www.rambhajo.com