
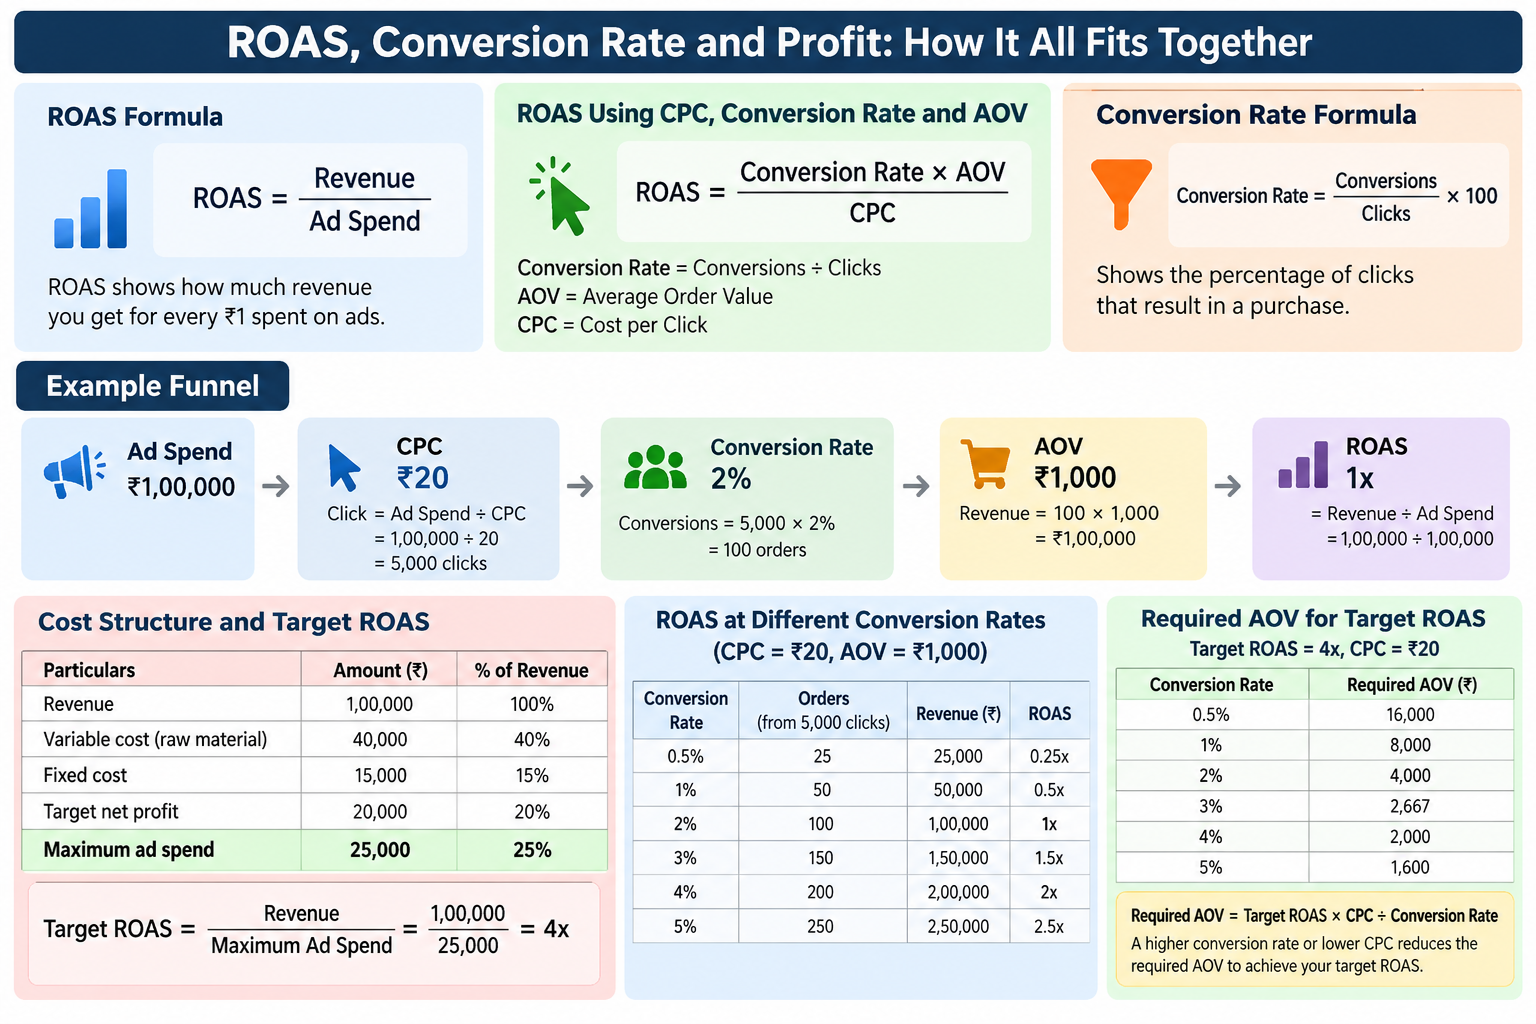
Executive summary
ROAS (Return on Ad Spend) measures attributed revenue relative to advertising expenditure. It does not, by itself, measure contribution or net profit. To judge campaign economics, a business must deduct the relevant variable costs, then advertising costs, and finally any remaining operating expenses. CM1, CM2 and CM3 are commonly used as successive contribution levels, but each company must document exactly which costs belong in each level.
1. ROAS, contribution and profit are different
Suppose a campaign spends ₹1,00,000 and reports ₹5,00,000 in attributed revenue. ROAS = ₹5,00,000 ÷ ₹1,00,000 = 5.0x (500%). This means ₹5 of attributed revenue per ₹1 of ad spend; it does not mean a 500% profit.
Metric |
Calculation |
What it means |
ROAS |
Attributed revenue ÷ ad spend |
Revenue efficiency of advertising |
Contribution margin |
(Revenue − defined variable costs) ÷ revenue |
Share of revenue left after those costs |
Contribution after ads |
Pre-ad contribution − ad spend |
Contribution remaining after advertising |
Net profit |
Revenue − all applicable expenses |
Final profit after all included costs |
2. CM1, CM2 and CM3: use a clearly defined cost ladder
There is no universal definition that assigns every expense to CM1, CM2 or CM3 in every company. The following is an illustrative structure; align it with your finance team's definitions.
Level |
Illustrative calculation |
Example costs |
CM1 |
Net revenue − first variable-cost layer |
Processing, materials, chemicals, packaging |
CM2 |
CM1 − additional variable costs |
Pickup/delivery, payment fees, other fulfilment costs |
CM3 |
CM2 − marketing costs (if defined this way) |
Paid advertising and attributable marketing |
Avoid double-counting: if advertising has already been deducted in CM3, do not subtract it again. CM3 is not automatically net profit if rent, fixed salaries, corporate overhead, interest, taxes or other expenses remain outside the calculation.
3. Worked example: from ₹5 lakh revenue to contribution after ads
Line item |
Amount |
Calculation / interpretation |
Attributed revenue |
₹5,00,000 |
Revenue attributed to the campaign |
Direct variable costs |
−₹2,50,000 |
Illustrative first cost layer |
CM1 |
₹2,50,000 (50%) |
₹5,00,000 − ₹2,50,000 |
Additional variable costs |
−₹50,000 |
Illustrative fulfilment layer |
CM2 |
₹2,00,000 (40%) |
CM1 − ₹50,000 |
Advertising spend |
−₹1,00,000 |
Paid media cost |
Contribution after ads |
₹1,00,000 (20%) |
CM2 − ad spend; before excluded expenses |
ROAS |
5.0x |
₹5,00,000 ÷ ₹1,00,000 |
Interpretation: the campaign has a 5x ROAS, but the amount remaining after the costs shown is ₹1,00,000, not ₹5,00,000. The ₹1,00,000 is contribution after ads—not necessarily net profit.
4. Why 3.33x ROAS targets a 10% post-ad contribution margin
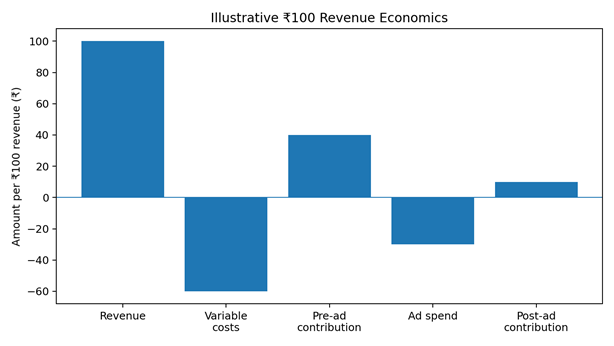
Assume the pre-ad contribution margin is 40%. Out of every ₹100 in revenue, ₹40 remains after relevant variable costs and before advertising. If the target is to retain ₹10 per ₹100 of revenue after advertising, then ₹30 per ₹100 is available for advertising.
Use of each ₹100 revenue |
Amount |
Revenue |
₹100 |
Variable costs (60%) |
−₹60 |
Pre-ad contribution (40%) |
₹40 |
Advertising spend allowed (30%) |
−₹30 |
Contribution after ads (10%) |
₹10 |
Target ROAS = 1 ÷ (Pre-ad contribution margin − desired post-ad contribution margin)
Target ROAS = 1 ÷ (0.40 − 0.10) = 1 ÷ 0.30 = 3.33x
This means the business needs approximately ₹3.33 in revenue for each ₹1 of advertising expenditure to retain a 10% contribution margin after ads under these assumptions. It does not guarantee 10% net profit.
5. Break-even ROAS versus target ROAS
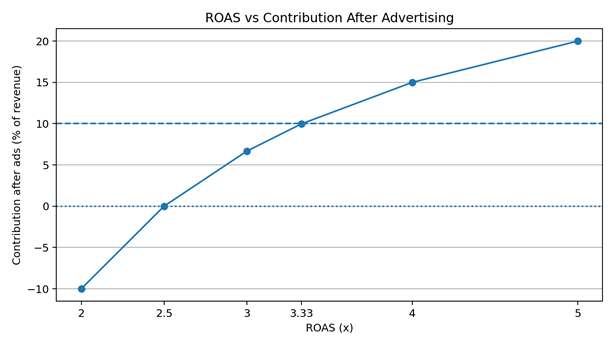
Break-even ROAS covers advertising using the contribution generated before advertising. Target ROAS can be higher because the business wants to retain a specified contribution after ads.
ROAS |
Revenue per ₹100 ad spend |
Post-ad contribution margin |
Interpretation |
2x |
₹200 |
-10.00% |
Negative contribution |
2.5x |
₹250 |
0.00% |
Break-even on contribution |
3x |
₹300 |
6.67% |
Positive contribution |
3.33x |
₹333 |
9.97% |
Approximately 10% retained |
4x |
₹400 |
15.00% |
Positive contribution |
5x |
₹500 |
20.00% |
Positive contribution |
Metric |
Campaign A |
Campaign B |
Revenue |
₹5,00,000 |
₹4,00,000 |
Ad spend |
₹1,00,000 |
₹1,00,000 |
ROAS |
5.0x |
4.0x |
Pre-ad contribution margin |
20% |
40% |
Contribution before ads |
₹1,00,000 |
₹1,60,000 |
Contribution after ads |
₹0 |
₹60,000 |
Campaign A has higher ROAS but produces no contribution after advertising in this example. Campaign B has lower ROAS but leaves ₹60,000. This is why campaign decisions should consider margin as well as revenue efficiency.
7. Important caveats before using this in a real business
·Use net realized revenue consistently; account for discounts, cancellations and refunds where relevant.
·Use the same revenue basis for contribution-margin and ROAS calculations.
·Check whether reported conversion value is attributed revenue, booked revenue, collected revenue or net revenue.
·Consider attribution overlap and whether ads generated incremental sales.
·Separate new-customer CAC from cost per conversion when repeat customers are included.
·Do not treat contribution after ads as net profit if fixed overheads and other costs remain.
·Use marginal performance when scaling; historical average ROAS may not hold at higher spend.
8. Final takeaway
ROAS measures attributed revenue per rupee of advertising. CM1, CM2 and CM3 show contribution after successive cost layers, as defined by the business. Break-even ROAS shows the revenue efficiency required to cover advertising from pre-ad contribution. A target ROAS can be set to retain a chosen post-ad contribution margin. Net profit is determined only after all applicable expenses are accounted for.
The goal is not just to generate more revenue. It is to generate incremental revenue that leaves enough contribution to cover costs and support sustainable profit.