Customer Acquisition Cost and Attribution: The Real Problem Behind Unprofitable Marketing
Customer Acquisition Cost (CAC) is one of the most important metrics in digital marketing. However, many businesses calculate CAC incorrectly because their attribution is incomplete. A company may know how much it spends on Google Ads, Meta Ads, SEO or other channels and how many leads they generate, but still struggle to identify which campaigns actually create customers and revenue.
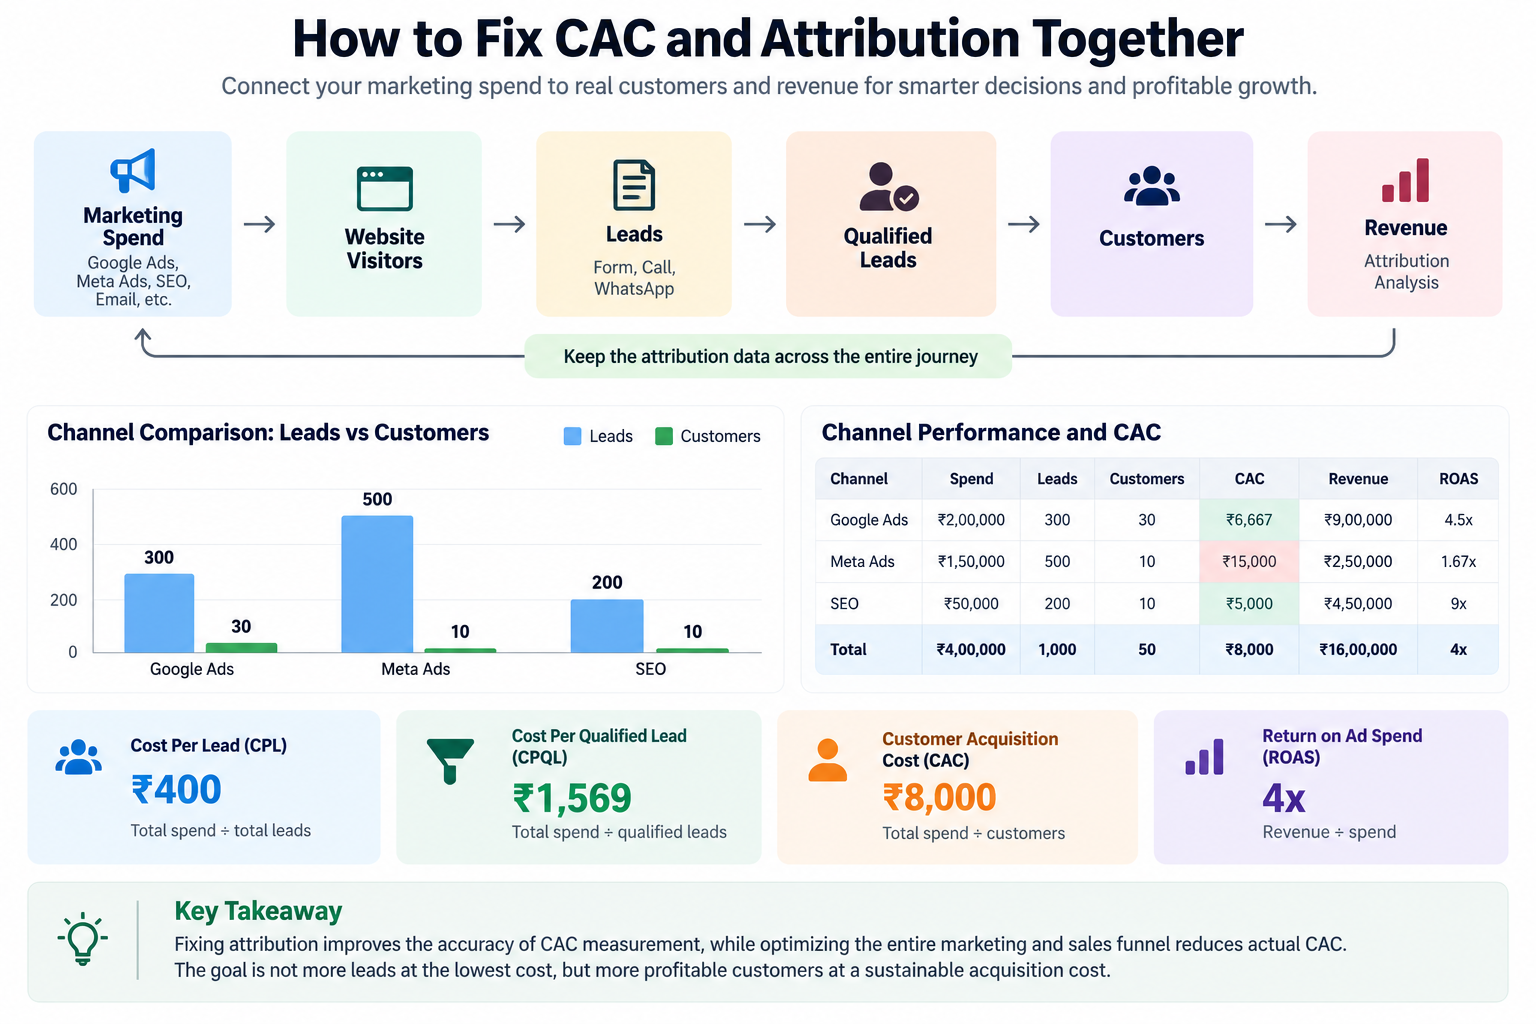
The real challenge is connecting Marketing Spend → Visitor → Lead → Qualified Lead → Opportunity → Customer → Revenue. When this connection breaks, CAC becomes unreliable and teams can scale channels that generate cheap leads but poor customers.
What Is Customer Acquisition Cost?
CAC = Total Customer Acquisition Cost ÷ Number of New Customers
Example: ₹4,50,000 acquisition spend ÷ 45 new customers = ₹10,000 CAC.
Why CAC and Attribution Must Be Solved Together
CAC tells you how much it costs to acquire customers. Attribution tells you which marketing interactions contributed to those customers. Without reliable attribution, overall CAC may be available but campaign-level CAC is difficult to trust.
Channel | Spend | Leads | Customers |
Google Ads | ₹2,00,000 | 300 | 30 |
Meta Ads | ₹1,50,000 | 500 | 10 |
SEO | ₹50,000 | 200 | 10 |
Total | ₹4,00,000 | 1,000 | 50 |
Blended CAC = ₹4,00,000 ÷ 50 = ₹8,000. Google Ads ≈ ₹6,667 CAC; Meta Ads = ₹15,000; SEO = ₹5,000.
The Core Problem: Data Continuity
Advertising platforms, analytics, websites, forms, CRMs, sales systems and finance systems often contain different parts of the customer journey. The problem is not lack of data; it is lack of connected data.
Ideal flow: Google Ads / Meta Ads / SEO / Email / Organic / Referral → Website → Tracking Parameters → Lead → CRM → Qualified Lead → Opportunity → Customer → Revenue → Attribution → Budget Optimization.
What Data Should Be Captured?
Field | Example |
Lead ID | L000125 |
First Source | |
First Campaign | Bangalore_Search |
Latest Source | |
Latest Campaign | Laundry_Near_Me |
UTM Source | |
UTM Medium | cpc |
UTM Campaign | laundry_near_me |
UTM Term | laundry near me |
GCLID | Click identifier |
FBCLID | Meta click identifier |
Landing Page | /laundry-in-bangalore |
Lead Date | 5 Oct 2026 |
Customer Date | 10 Oct 2026 |
Revenue | ₹28,000 |
First-Touch, Last-Touch and Multi-Touch Attribution
First-Touch Attribution
Gives credit to the first identifiable marketing interaction and helps identify demand-creation channels.
Last-Touch Attribution
Gives credit to the final identifiable interaction before conversion and helps identify channels closest to conversion.
Multi-Touch Attribution
Distributes credit across multiple interactions. A simplified four-touch linear model could assign 25% to each interaction.
Why CPL Can Be a Dangerous Metric
A campaign can have a lower CPL but a much higher CAC because lead quality and sales conversion differ.
Metric | Campaign A | Campaign B |
Spend | ₹1,00,000 | ₹1,00,000 |
Leads | 500 | 200 |
CPL | ₹200 | ₹500 |
Qualified Leads | 50 | 80 |
Customers | 5 | 20 |
CAC | ₹20,000 | ₹5,000 |
Campaign A has 60% lower CPL, but Campaign B has 75% lower CAC. The cheapest lead is not necessarily the cheapest customer.
The Full-Funnel Marketing Model
Illustrative funnel: 50,000 visitors → 1,000 leads → 250 qualified leads → 100 opportunities → 40 customers. With ₹4,00,000 spend, CAC = ₹10,000.
Stage | Number | Conversion |
Website Visitors | 50,000 | — |
Leads | 1,000 | 2.0% |
Qualified Leads | 250 | 25.0% |
Opportunities | 100 | 40.0% |
Customers | 40 | 40.0% |
CAC Can Be Reduced Without Reducing Advertising Spend
₹5,00,000 spend and 25 customers produces ₹20,000 CAC. If funnel improvements produce 40 customers from the same spend, CAC becomes ₹12,500 — a 37.5% reduction.
The Role of Sales Conversion in CAC
With ₹3,00,000 spend and 1,000 leads, a 3% lead-to-customer rate creates 30 customers and ₹10,000 CAC. Improving conversion to 5% creates 50 customers and ₹6,000 CAC.
Common Attribution Problems
- UTM Parameters Are Lost
- Parameters can disappear when users move through redirects, links or pages.
- Redirects Remove Tracking Parameters
- Redirects that do not preserve query parameters can break source information.
- Forms Do Not Store Acquisition Data
- The website may know the source while the CRM receives only name, phone, email and message.
- Phone Calls Are Disconnected
- A user can click an ad and call, but the CRM may classify the call as direct or unknown.
- WhatsApp Leads Become Unattributed
- Users can arrive from advertising and then move into WhatsApp without campaign data being carried into the CRM.
Why Persistent Lead IDs Matter
Every lead should receive a unique ID such as L000125. The same identifier should remain through qualification, opportunity, customer and revenue stages.
Offline Conversion Tracking
A form submission is not necessarily the final business outcome. A campaign may generate 100 leads but only 10 customers. Where technically appropriate, downstream qualified-lead, customer or revenue signals should be used for optimization.
Example: How Revenue Changes Campaign Decisions
Channel | Spend | Leads | Customers | Revenue |
Google Ads | ₹2,00,000 | 300 | 30 | ₹9,00,000 |
Meta Ads | ₹1,50,000 | 500 | 10 | ₹2,50,000 |
SEO | ₹50,000 | 200 | 10 | ₹4,50,000 |
Illustrative results: Google CAC ≈ ₹6,667 and ROAS 4.5×; Meta CAC ₹15,000 and ROAS 1.67×; SEO CAC ₹5,000 and ROAS 9×. These are examples, not industry benchmarks.
CAC vs LTV
CAC should be evaluated alongside Customer Lifetime Value. Example: ₹10,000 CAC and ₹60,000 lifetime revenue gives a simplified 6:1 LTV:CAC ratio. A ₹5,000 CAC with ₹7,500 lifetime revenue gives 1.5:1.
The Three Levels of Marketing Metrics
Level | Metrics |
Acquisition | Spend, impressions, clicks, CPC, leads, CPL |
Quality | Qualified leads, CPQL, opportunities, sales conversion |
Business Outcome | Customers, CAC, revenue, ROAS, LTV, LTV:CAC |
How to Fix CAC and Attribution Together
1. Standardize Tracking
Use a consistent UTM naming convention.
2. Capture Identifiers
Retain applicable GCLID, FBCLID and UTM values.
3. Store Attribution in the CRM
Store first-touch, latest-touch, campaign, landing page and identifiers.
4. Connect CRM and Sales Outcomes
Use stages such as New Lead, Contacted, Qualified, Opportunity, Won and Customer.
5. Send Meaningful Conversion Signals Back
Use qualified-lead, customer or revenue outcomes where appropriate.
6. Calculate CAC at Multiple Levels
Measure CAC by channel, campaign, geography, product and customer segment.
A Better Marketing Dashboard
Metric | Meta | SEO | Total | |
Spend | ₹2L | ₹1.5L | ₹0.5L | ₹4L |
Leads | 300 | 500 | 200 | 1,000 |
CPL | ₹667 | ₹300 | ₹250 | ₹400 |
Qualified Leads | 100 | 75 | 80 | 255 |
CPQL | ₹2,000 | ₹2,000 | ₹625 | ₹1,569 |
Customers | 30 | 10 | 10 | 50 |
CAC | ₹6,667 | ₹15,000 | ₹5,000 | ₹8,000 |
Revenue | ₹9L | ₹2.5L | ₹4.5L | ₹16L |
ROAS | 4.5× | 1.67× | 9× | 4× |
What Should Be the Source of Truth?
Data | Recommended Source |
Advertising Spend | Ad platforms |
Website Behaviour | Analytics |
Lead Identity | CRM |
Lead & Sales Status | CRM |
Customer & Revenue | CRM / transaction system |
Attribution | CRM + analytics |
Financial CAC | Finance / BI |
Campaign Optimization | Ad platform + CRM feedback |
Final Example: From Broken Attribution to Reliable CAC
A company spends ₹10,00,000 and generates 2,500 leads. It reports ₹400 CPL and approximately 60 customers, but 20 customer records have unknown acquisition sources. Blended CAC is approximately ₹16,667, but campaign-level CAC cannot be trusted.
Channel | Customers | Illustrative CAC |
Google Ads | 30 | ₹13,333 |
Meta Ads | 10 | ₹25,000 |
SEO | 15 | ₹8,000 |
Referral | 5 | ₹4,000 |
Conclusion
CAC and attribution are connected. If attribution is broken, CAC becomes unreliable. If CAC is measured only from leads, campaign optimization can be misleading. The practical approach is to track the customer journey, preserve attribution data, connect it to CRM, connect CRM outcomes to customers and revenue, calculate CAC, and optimize toward profitable customers.