Executive summary
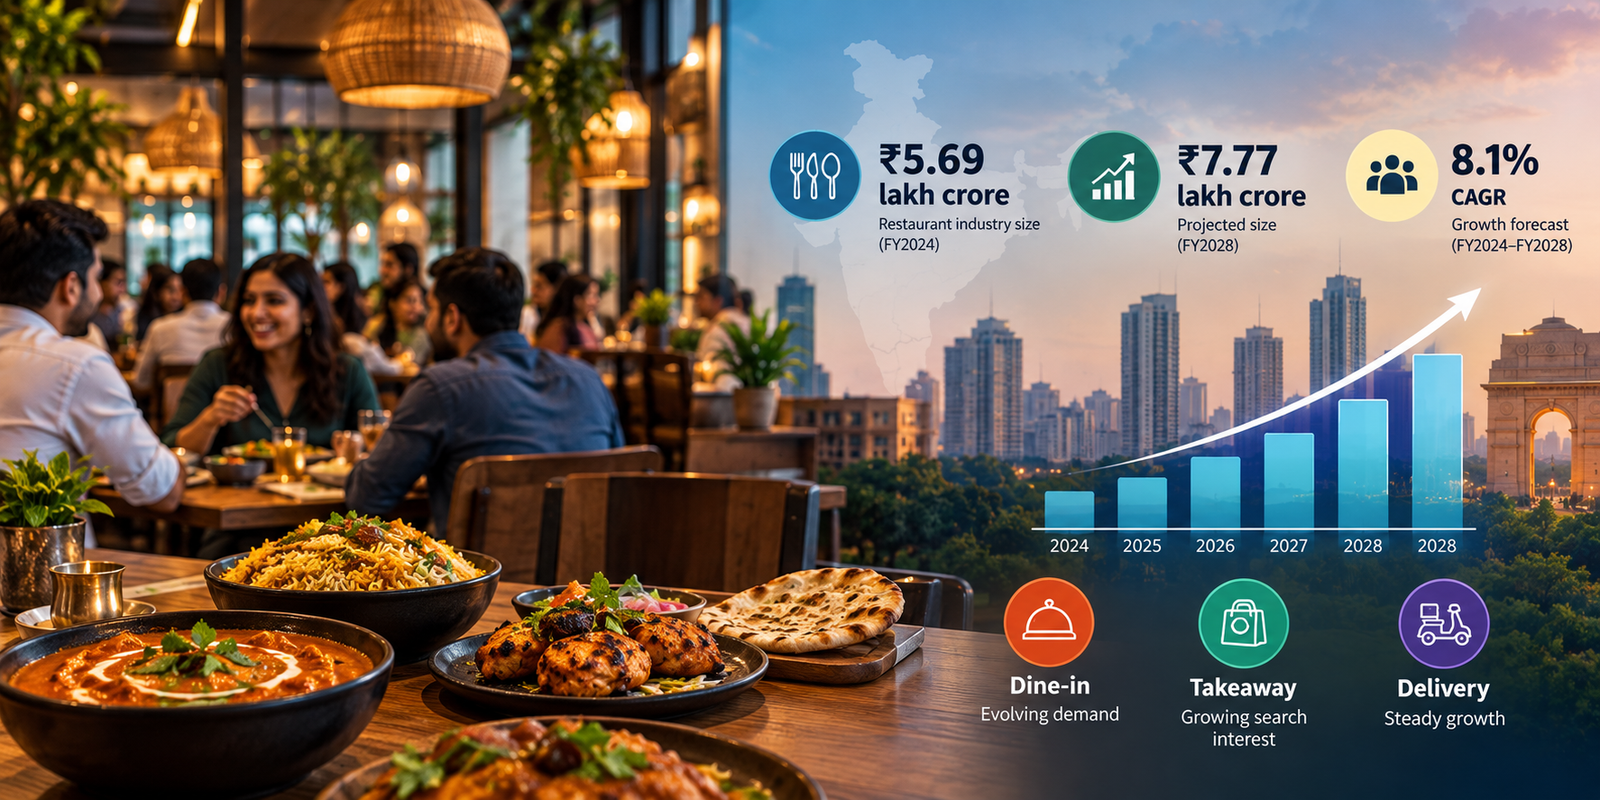
NRAI’s 2024 industry estimate puts India’s food-services market at ₹5.69 lakh crore in FY24 and projects ₹7.77 lakh crore by FY28, with an 8.1% CAGR; the organised segment is projected to grow faster at 13.2%.
The USDA Foreign Agricultural Service’s December 2025 HRI report estimates food service at US$85 billion in 2025 and projects US$140 billion by 2030 (10.4% CAGR). This is a separate estimate and should not be directly merged with NRAI’s rupee series.
IBEF’s January 2025 blog highlights cafés and bars as a distinct opportunity: US$17.54 billion estimated for 2024 and US$26.17 billion projected by 2029, with a stated 8.33% CAGR for 2024–2029.
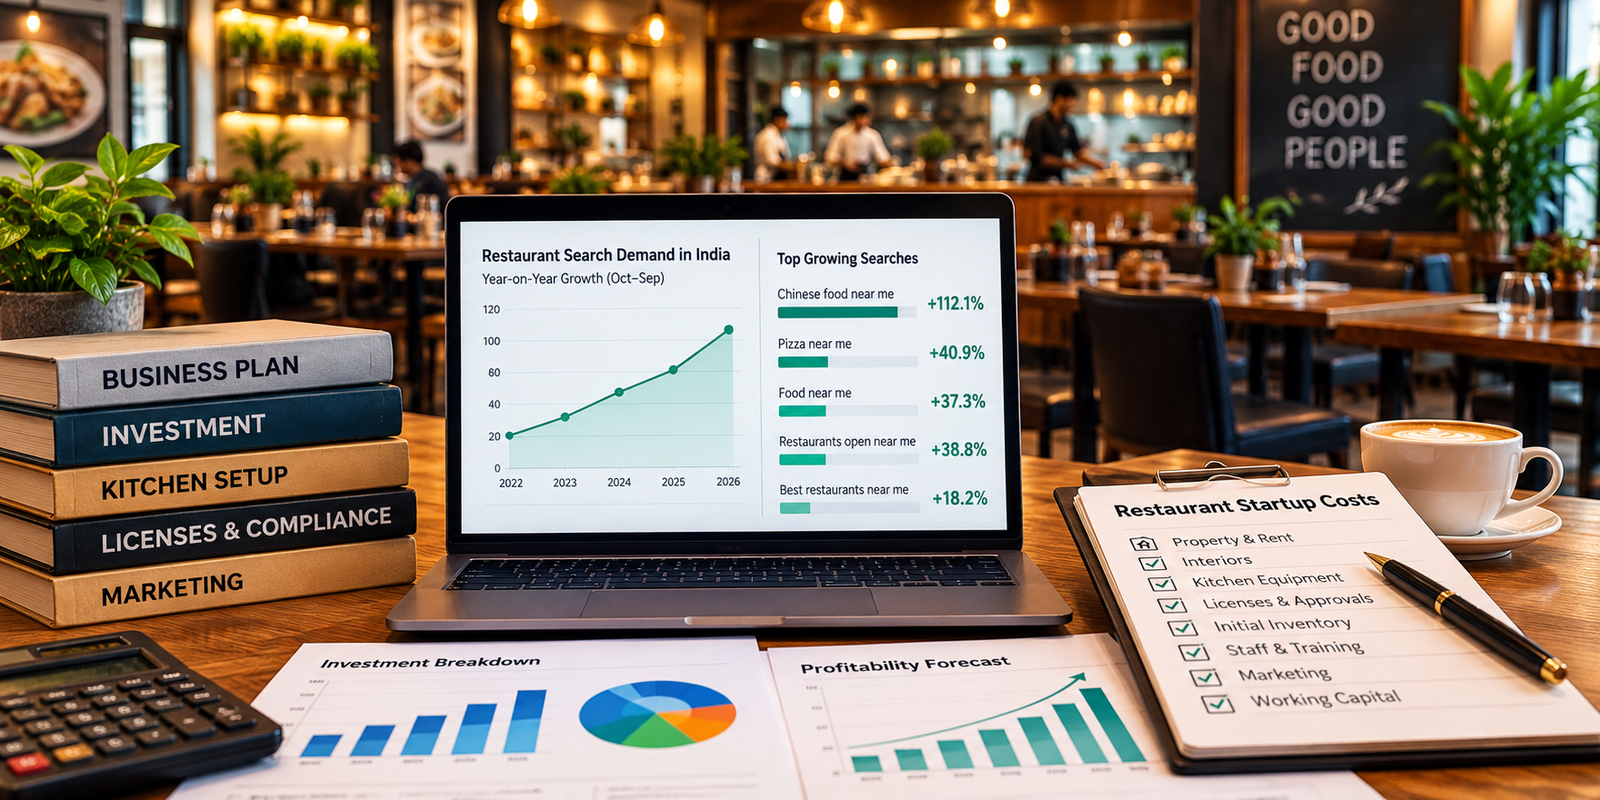
In report, “food near me”, “pizza near me”, “Chinese food near me”, “mandi restaurant near me” and “cloud kitchen near me” show rising average monthly reported search volume across Oct 2025–Sep 2026 versus Oct 2024–Sep 2025. These are discovery signals—not sales or proof of profitability.
1. Market size: two sources, two measurement frames
The NRAI India Food Services Report 2024 is the relevant restaurant-sector benchmark in the supplied sources. It reports ₹5,69,487 crore for FY24 and projects ₹7,76,511 crore by FY28. IBEF’s coverage of the report also states 1.9% contribution to GDP, 8.5 million current jobs, and more than 10.3 million jobs by 2028. The NRAI newsletter notes that its report involved discussions with 140+ CEOs and consumer research covering 5,300+ people across 40+ cities.
Figure 1. NRAI FY24 estimate versus FY28 projection. Values are in ₹ lakh crore. The projection is not a measured FY28 outcome.
A separate USDA Foreign Agricultural Service report, published 31 December 2025, estimates the food-service industry at US$85 billion in 2025 and projects US$140 billion by 2030, implying a reported 10.4% CAGR. Its HRI framing and methodology differ from NRAI’s India Food Services Report; use it as an independent scenario, not as a direct continuation of the NRAI series.
Figure 2. USDA FAS HRI report’s food-service estimate and projection. Do not combine these dollar values with NRAI’s rupee values into a single trend line.
2. The structure is changing: organised formats, QSRs and cloud kitchens
IBEF’s July 2024 coverage of the NRAI report says the organised segment is projected to grow at 13.2% CAGR and reach 52.9% share by 2028, up from 43.8%. Casual dining restaurants (CDRs) are reported as the largest organised segment, with 48% share; QSRs are expected to gain roughly 4–5 percentage points by 2028 at the expense of CDRs. These are sector-level projections from the report, not a guarantee for every brand or location.
The USDA FAS report describes more than 500,000 restaurant outlets across formats, rising delivery use, and cloud kitchens growing at a reported 13% CAGR. It also describes full-service restaurants as 32% of the restaurant sector and projects that segment to reach US$65 billion by 2030; QSRs are projected at US$43.5 billion, while cafés and bars are projected to reach US$30 billion by 2030. These format figures come from the USDA report and should be cited with that source rather than treated as NRAI figures.
3. Café and bar opportunity: experience is part of the product
IBEF’s 8 January 2025 blog, citing Mordor Intelligence, estimates India’s café and bar market at US$17.54 billion in 2024 and projects US$26.17 billion by 2029, with an 8.33% CAGR over 2024–2029. The article links this opportunity to younger consumers, cafés that double as work and social spaces, themed concepts such as pet-friendly and book cafés, and the growth of branded tea chains. It also describes sustainability, health-focused menus, digital ordering and cloud-kitchen models as important shifts.
Indicator | Reported figure | Source / interpretation |
Café and bar market, 2024 | US$17.54 billion | IBEF blog citing Mordor Intelligence |
Café and bar projection, 2029 | US$26.17 billion | IBEF blog; projected value |
Café and bar CAGR, 2024–2029 | 8.33% | IBEF blog citing Mordor Intelligence |
Bars and clubs in India | Over 65,000 | IBEF blog; reported count |
Millennials as share of population | Over 35% | IBEF blog; contextual demographic claim |
4. What the keyword-tool report adds: live discovery signals
The industry reports describe market scale and structural forecasts. The keyword-tool file adds a different lens: estimated search demand for specific phrases. The following calculations use the 24 monthly values reported for Oct 2024–Sep 2026. Each 12-month period is compared using average monthly volume. Current snapshot volume is shown separately and is not used as either period average.
Keyword | Current snapshot volume | Avg. monthly volume Oct 24–Sep 25 | Avg. monthly volume Oct 25–Sep 26 | YoY change |
restaurants near me | 624,000 | 678,285 | 623,528 | -8.1% |
food near me | 159,000 | 116,018 | 159,277 | +37.3% |
cafes near me | 117,000 | 104,247 | 116,536 | +11.8% |
pizza near me | 83,000 | 59,126 | 83,336 | +40.9% |
chinese food near me | 23,000 | 10,932 | 23,190 | +112.1% |
food delivery near me | 14,000 | 12,901 | 14,258 | +10.5% |
mandi restaurant near me | 11,000 | 7,770 | 10,937 | +40.8% |
cloud kitchen near me | 9,100 | 7,155 | 9,082 | +26.9% |
dine in restaurants near me | 1,200 | 1,560 | 1,209 | -22.5% |
Figure 3. Year-on-year change in average monthly reported search volume. Positive values indicate higher estimated search volume in the recent 12-month period; they do not indicate equivalent growth in restaurant sales.
Figure 4. Monthly historical trajectories indexed separately for each keyword to October 2024 = 100. The index compares the shape of each phrase’s series, not absolute demand between phrases. Spikes may reflect seasonality, revisions or data-provider noise.
5. What the search trends suggest—and what they do not
“Food near me” is a broad local discovery phrase. Its increase can support investment in location pages and local profiles, but it does not reveal which restaurant format captures the demand.
“Pizza near me” and “Chinese food near me” can inform cuisine-specific landing pages, menu categories and location-level content. Cuisine growth should be checked by city before making a national menu or investment decision.
“Mandi restaurant near me” is a narrower cuisine/format signal. A high growth rate from a smaller base is not the same as a large market; assess absolute volume, local competition, ticket size and repeat demand.
“Cloud kitchen near me” shows whether people search for the concept locally, but it is not a direct proxy for cloud-kitchen revenue, orders or market share.
Search phrases overlap. Do not add similar keywords as if they were unique consumers. The report’s forecast series is a model output, not observed future demand.
6. Opportunity map for founders and operators
Opportunity | Evidence in supplied sources | Practical decision |
Organised restaurant formats | NRAI coverage projects organised segment CAGR of 13.2% and 52.9% share by 2028. | Evaluate brand consistency, supply chain, repeatability and unit economics before scaling. |
QSR and delivery-led models | USDA FAS report notes QSR expansion and cloud kitchens growing at 13% CAGR. | Model delivery commissions, packaging, kitchen throughput and contribution margin separately. |
Cafés and bars | IBEF cites US$17.54B in 2024 and US$26.17B projected by 2029. | Validate local footfall, average order value, daypart demand and seat utilisation. |
Cuisine-specific local SEO | Keyword report shows positive YoY signals for selected cuisine queries. | Create useful city/service pages only where there is real menu availability and operational coverage. |
Tier-2 and tier-3 expansion | IBEF and USDA describe expansion beyond the largest metros and growing travel infrastructure. | Test demand city-by-city; do not assume national growth applies uniformly. |
Supplier and ingredient opportunities | USDA FAS report identifies premium nuts, sauces, seasonings, dressings and ready-to-use formats as prospects for HRI buyers. | For supplier businesses, validate import rules, landed cost, distribution access and buyer specifications. |
7. A practical validation framework before investing
Demand: compare 24 months of keyword trends with city-level search demand, seasonality and competitor visibility.
Competition: map existing outlets, cuisine density, ratings, pricing and delivery availability in the target catchment.
Unit economics: model rent, food cost, labour, utilities, packaging, delivery commissions, marketing and wastage. Separate dine-in, takeaway and delivery contribution margins.
Market evidence: use NRAI/IBEF/USDA figures for sector context, not as a substitute for local customer research or outlet-level sales data.
Validation: run a pilot, measure transactions and repeat rates, then compare actual performance with the assumptions in the business plan.
Conclusion
India’s restaurant opportunity is not one single growth story. The supplied sources point to a large and expanding food-services market, faster projected growth in the organised segment, opportunities across QSRs and cloud kitchens, and a distinct café-and-bar experience economy. The keyword report complements this market context by identifying which food and cuisine phrases are gaining search attention. The strongest investment decision combines all three: sector-level market estimates, local search signals, and verified outlet economics.