Executive summary: the strongest signals in the dataset
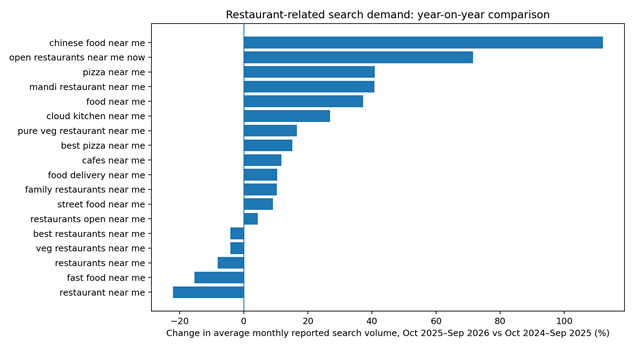
·“restaurants near me” is the largest restaurant-intent keyword in the selected set, with a reported current volume of 624,000. Its average monthly historical volume fell 8.1% between the two 12-month periods in the workbook.
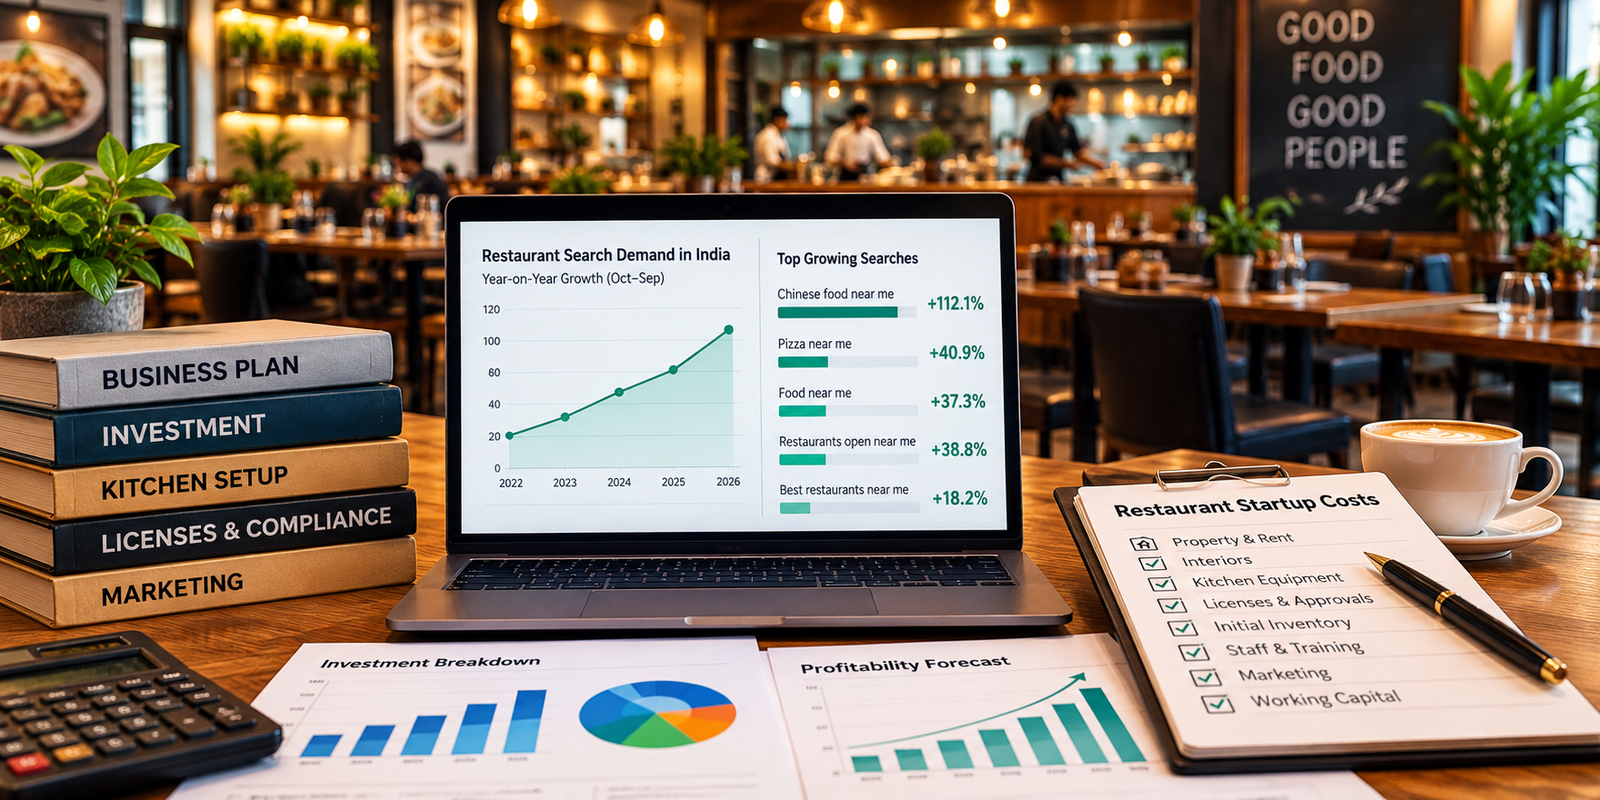
·“food near me” has a reported volume of 159,000 and rose 37.3% year on year on the workbook’s monthly history.
·“pizza near me” has a reported volume of 83,000 and grew 40.9%; “Chinese food near me” has a smaller reported volume of 23,000 but grew 112.1% year on year.
·“cafes near me” shows 117,000 reported volume and 11.8% year-on-year growth; “cloud kitchen near me” shows 9,100 and 26.9% growth.
·Not every generic restaurant phrase is rising: “restaurant near me” is down 22.1%, “fast food near me” down 15.3%, and “best restaurants near me” down 4.2% in the same comparison.
·The report’s forecast is a model output, not a guarantee. Use it as a planning signal and validate it against actual impressions, clicks, leads, orders and local demand.
1. Data and Method: Source and Interpretation
The analysis uses keyword data reported by the keyword research tool. Restaurant- and food-related phrases are selected for analysis rather than treating all reported keywords as restaurant demand.
The current search volume, historical search-volume data, and forecast values are taken from the respective fields in the keyword tool report. Current search volume represents the snapshot reported by the tool, while historical monthly values are used to compare search demand across equivalent periods.
For the year-on-year comparison, the 24 monthly historical values are divided into October 2024–September 2025 and October 2025–September 2026. The percentage change is calculated as:
YoY Change (%) = ((Recent 12-month total ÷ Previous 12-month total) − 1) × 100
Because both periods cover 12 months, comparing their totals produces the same percentage change as comparing their monthly averages.
Important limitations: The trend classifications reported by the keyword tool should be treated as indicative patterns, not statistical guarantees. Search-volume estimates may fluctuate due to seasonality, changes in demand, data-provider revisions, and keyword grouping. Similar phrases, such as “restaurants near me” and “restaurant near me,” should not be added together as though they represent unique people. Search volume indicates estimated search demand, not confirmed restaurant visits, orders, revenue, or purchasing behaviour.
2. High-volume local discovery: scale is not the same as growth
The largest keyword is “restaurants near me” at 624,000 reported volume. Its historical monthly average moved from approximately 678,285 in October 2024–September 2025 to 623,528 in October 2025–September 2026, a decline of 8.1%. Meanwhile, “food near me” moved from approximately 116,018 to 159,277 monthly searches, a 37.3% increase. This is a useful distinction: broad restaurant discovery remains large, but broader food-intent phrasing is growing faster in this dataset.
Keyword |
Current reported volume |
Prior-period monthly avg |
Recent-period monthly avg |
YoY change |
restaurants near me |
624,000 |
678,285 |
623,528 |
−8.1% |
food near me |
159,000 |
116,018 |
159,277 |
+37.3% |
restaurant near me |
135,000 |
172,724 |
134,598 |
−22.1% |
cafes near me |
117,000 |
104,247 |
116,536 |
+11.8% |
pizza near me |
83,000 |
59,126 |
83,336 |
+40.9% |
best restaurants near me |
79,000 |
82,200 |
78,782 |
−4.2% |
Business implication: do not base a content strategy only on the biggest keyword. Build pages that match specific intent—nearby dining, cuisine, opening hours, cafe visits, delivery, and specific dishes—then measure which pages generate calls, direction requests, reservations or orders. A declining phrase can still be strategically important because its absolute volume remains large.
3. Cuisine-level demand: smaller terms can show stronger momentum
Keyword |
Current reported volume |
YoY change |
Workbook trend label |
Interpretation |
pizza near me |
83,000 |
+40.9% |
Growing / mixed |
Large local-intent term with strong growth |
Chinese food near me |
23,000 |
+112.1% |
Growing / mixed |
Fast growth from a smaller base; validate local competition |
mandi restaurant near me |
11,000 |
+40.8% |
Exponential-like |
Cuisine-specific intent appears to be gaining traction |
pure veg restaurant near me |
13,000 |
+16.6% |
Linear-like |
Specific dietary/restaurant-format demand growing |
street food near me |
11,000 |
+9.1% |
Linear-like |
Steady local discovery signal |
fast food near me |
12,000 |
−15.3% |
Declining / damped |
Generic phrase weakens in this series; branded and item-level terms may differ |
veg restaurants near me |
89,000 |
−4.2% |
Growing / mixed |
Large term with slight historical decline; trend label should not replace calculation |
The sharpest growth rates need careful interpretation. “Chinese food near me” grew 112.1% year on year, but its current reported volume is much smaller than “pizza near me”. A high percentage change from a smaller base does not automatically mean it is the largest commercial opportunity. Check the city, competition, menu economics and conversion rate before investing.
4. Delivery and emerging-format signals
Keyword |
Current reported volume |
YoY change |
Forecast trend label |
food delivery near me |
14,000 |
+10.5% |
Linear-like |
cloud kitchen near me |
9,100 |
+26.9% |
Linear-like |
family restaurants near me |
16,000 |
+10.4% |
Damped growth |
restaurants open near me |
7,700 |
+4.4% |
Growing / mixed |
open restaurants near me now |
5,100 |
+71.6% |
Growing / mixed |
best pizza near me |
6,900 |
+15.2% |
Exponential-like |
These results do not prove that consumers are abandoning dine-in for delivery. The dataset measures keyword demand, not actual order channel share. A more defensible conclusion is that delivery-related and cloud-kitchen terms show growth, while specific convenience and cuisine queries may reveal useful acquisition opportunities. To test a dine-in versus delivery strategy, compare actual orders, revenue, contribution margin, repeat rate and customer acquisition cost by channel.
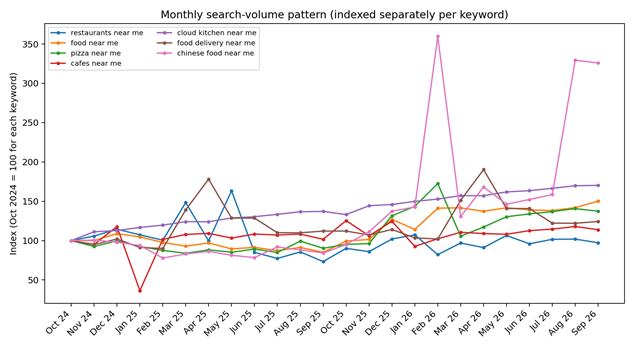
The chart indexes each keyword separately to 100 in October 2024. It is designed to compare direction and volatility, not absolute market size. The curves should not be summed or read as shares of the restaurant market.
5. What the forecast says through October 2027
Keyword |
Forecast Oct 2026 |
Forecast Oct 2027 |
First-to-last forecast change |
Historical trend label |
restaurants near me |
702,540 |
722,903 |
+2.9% |
Declining / damped |
food near me |
185,101 |
199,443 |
+7.7% |
Growing / mixed |
pizza near me |
87,005 |
94,312 |
+8.4% |
Growing / mixed |
cafes near me |
121,200 |
132,522 |
+9.3% |
S-curve / saturation-like |
chinese food near me |
24,222 |
26,310 |
+8.6% |
Growing / mixed |
cloud kitchen near me |
9,675 |
11,602 |
+19.9% |
Linear-like |
food delivery near me |
13,890 |
15,246 |
+9.8% |
Linear-like |
mandi restaurant near me |
13,185 |
15,667 |
+18.8% |
Exponential-like |
open restaurants near me now |
4,441 |
5,578 |
+25.6% |
Growing / mixed |
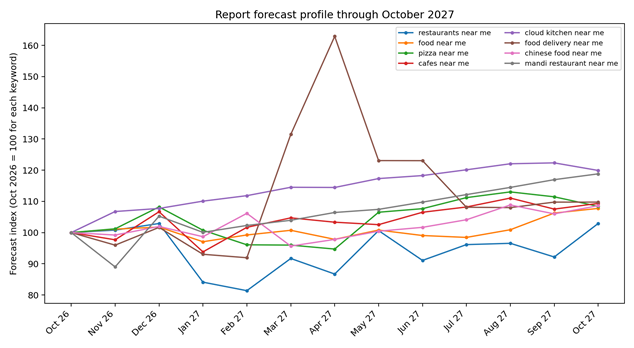
Forecast values are model-generated estimates supplied by the workbook. For example, the forecast series for “cloud kitchen near me” rises from 9,675 in October 2026 to 11,602 in October 2027, while “food near me” rises from 185,101 to 199,443. These are forecast values, not observed future search volumes. The forecast path may not fully account for seasonality, platform changes, or sudden shifts in consumer behaviour.
6. External market context: industry size versus search demand
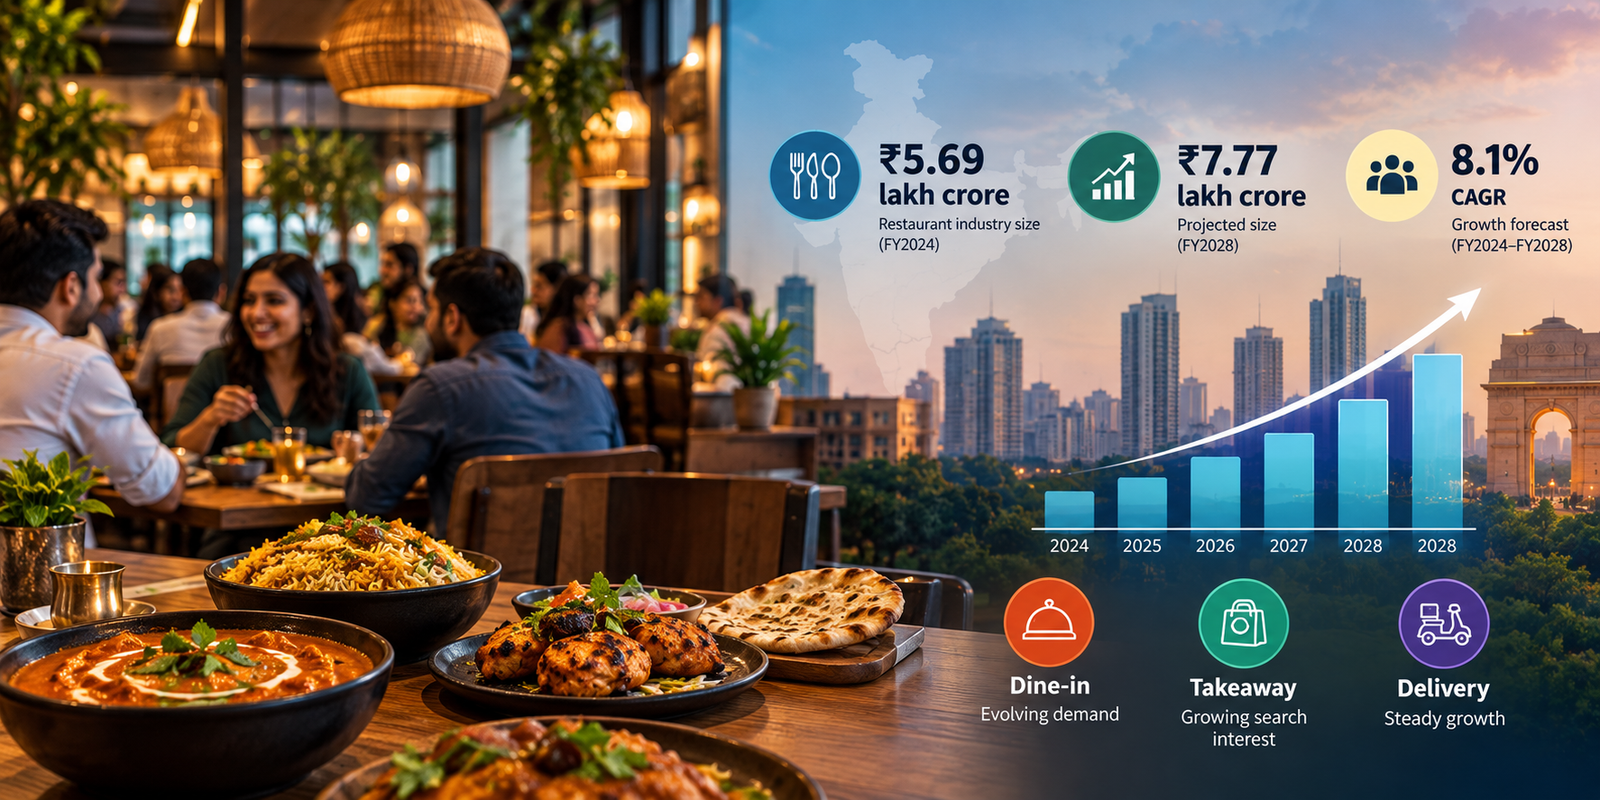
The National Restaurant Association of India’s India Food Services Report 2024, as summarized in NRAI materials, estimates India’s food services industry at ₹5,69,487 crore in FY2024 and projects ₹7,76,511 crore by FY2028, equivalent to 8.1% CAGR. The organised segment is projected to grow faster at 13.2% CAGR. These are industry-wide estimates and projections; they are not derived from the keyword workbook and should not be presented as search-derived market size. Source: NRAI materials: https://conference.nrai.org/files/uploads/2024/08/april-june-2024-newsletter.pdf and https://nrai.org/aboutNewsAndUpdate.aspx?ID=6EQtfBjriLQ%3D&Type=oS9yZygW1hU%3D
Together, the two evidence types answer different questions. Industry reports estimate the economic size and growth of food services; keyword data reveals how people phrase their searches and how that demand changes over time. Neither alone establishes the sales potential of one restaurant in one neighbourhood.
7. Practical SEO and market-entry priorities based on this report
·Protect high-volume local discovery: create strong location pages and Google Business Profiles with accurate menus, hours, photos, service details and conversion paths.
·Expand into cuisine-specific demand: test dedicated pages for pizza, Chinese food, mandi, pure-vegetarian and street-food concepts only where the restaurant genuinely serves those categories.
·Build useful convenience content: opening hours, “open now”, lunch, dinner, family dining and delivery coverage can match high-intent searches, but pages must provide accurate, location-specific information.
·Treat keyword clusters carefully: singular/plural and close variants may overlap. Avoid creating many thin pages that target nearly identical queries.
·Use city and neighbourhood validation: India-level search estimates do not tell you which locality has enough demand or what competitors rank there.
·Connect SEO to commercial outcomes: measure calls, bookings, direction requests, online orders, repeat purchases and contribution—not rankings and impressions alone.
·Run a quarterly refresh: update the same keyword cohort, compare matched 12-month windows, inspect seasonality, and label estimates separately from observed business results.
8. Recommended reporting dashboard
Metric |
Why it matters |
Recommended breakdown |
Reported keyword volume |
Relative scale of a query in the supplied data |
Keyword, country, update date |
Matched-period YoY change |
Shows whether demand rose or fell over comparable months |
Oct–Sep year pairs; same keyword cohort |
Forecast first-to-last change |
Planning signal, not a guarantee |
Oct 2026–Oct 2027; label as forecast |
Search Console impressions and clicks |
Measures actual visibility for your site |
Query, page, city/country, device |
Google Business Profile actions |
Measures local discovery outcomes |
Location, calls, website clicks, directions |
Orders, bookings and contribution |
Connects marketing to commercial outcomes |
Channel, cuisine, location, new vs repeat customer |
Conclusion
The most useful finding is not that “restaurants are booming” or “delivery is replacing dine-in”. The workbook shows a more mixed picture: broad “restaurants near me” demand remains large but declined in the matched historical comparison, while “food near me”, pizza, Chinese food, cafes, cloud kitchens and several specific convenience phrases show growth. That pattern supports a more granular strategy: prioritise high-intent local discovery, test cuisine-level demand, and use actual conversion data to decide where to invest.
Source and methodology notes
Primary dataset: Relevant tabs: Keyword Trends, Historical Graph Data, Forecast Graph Data . Historical period: October 2024–September 2026. Forecast period: October 2026–October 2027. Keyword current-volume snapshot is taken from the workbook’s Volume field. YoY change is calculated from the two 12-month historical blocks. Trend labels are copied from the workbook and are heuristic, not statistical proof. Industry context is sourced separately from NRAI materials and is not calculated from keyword data.
Editorial caution: validate the report provider’s definition of volume and update date before publication. Do not add similar keywords together as unique users; do not describe forecast data as observed results; and do not infer local sales, restaurant revenue, TAM or market share from search volume alone.