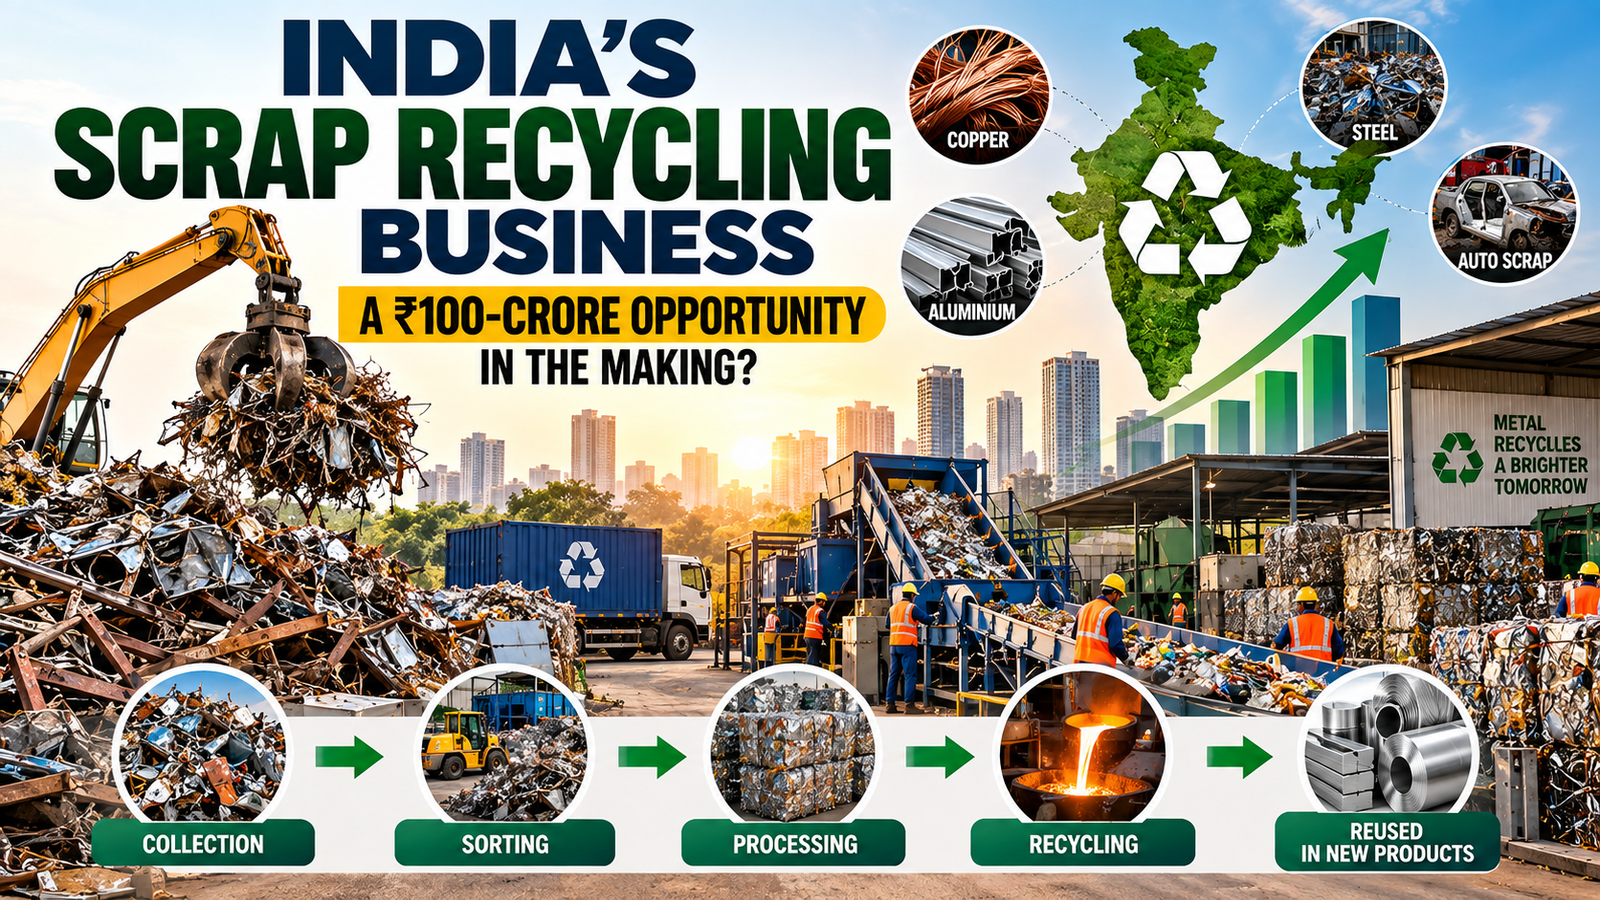
India’s scrap recycling industry is moving from a fragmented activity toward a more organized circular-economy and industrial supply-chain business. The opportunity extends across industrial scrap collection, aggregation, sorting, dismantling, processing, recycling, logistics, digital marketplaces and secondary-metal supply.
The National Non-Ferrous Metal Scrap Recycling Framework, 2020 identified low recycling rates, fragmented collection, dependence on imported scrap and limited organized processing infrastructure as major challenges.
Data note: several government figures in this report are historical 2019–2020 figures or policy projections. They are not presented as verified 2026 market measurements.
The Scale of India’s Ferrous Scrap Opportunity
Metric |
Historical figure |
Domestic unorganized scrap supply |
25 MT |
Imported scrap |
7 MT |
Total scrap consumption |
~32 MT |
Estimated scrap deficit |
~7 MT |
Scrap imports, 2017–18 |
>₹24,500 crore |
Scrap requirement for 250 MT steel production |
70–80 MT |
Processing centres required for 70 MT |
~700 |
Collection/dismantling centres required |
~2,800–3,000 |
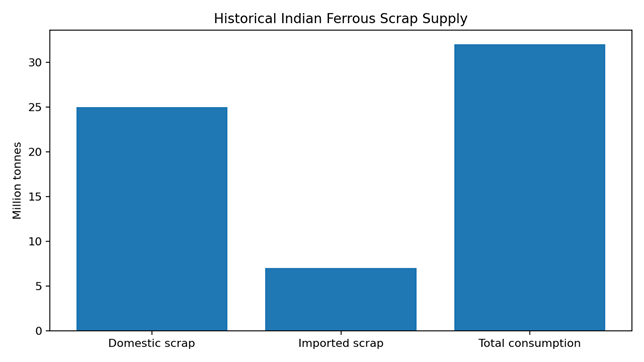
Source: Ministry of Steel Steel Scrap Recycling Policy and U.S. Trade.gov historical market overview.
India’s Non-Ferrous Recycling Gap
Metal |
Global benchmark |
India recycling rate |
Aluminium |
98.5% |
30% |
Lead |
>90% |
85% |
Copper |
82% |
20% |
Zinc |
>30% |
10% |
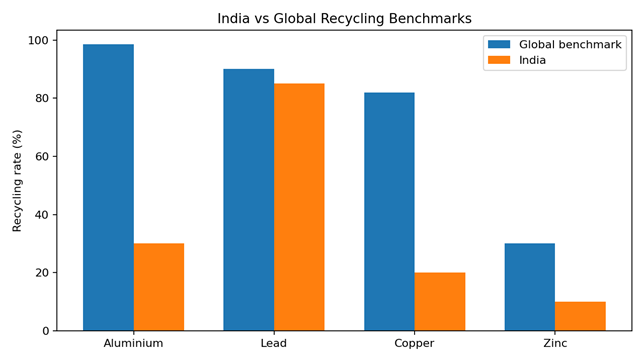
Source: National Non-Ferrous Metal Scrap Recycling Framework, 2020. These are historical framework figures.
Why Aluminium Scrap Could Be a Major Opportunity
The framework reported Indian aluminium consumption of approximately 3.7 million tonnes in FY2020(E), aluminium demand growth of 6.77% CAGR and production increasing from about 3.3 million tonnes in 2015 to around 5 million tonnes in 2019. It also stated that recycling aluminium requires 95% less energy than primary aluminium production.
Potential aluminium scrap sources
Automobile components; aluminium profiles; windows and doors; electrical components; manufacturing rejects; packaging; machinery; construction; consumer products.
Copper Scrap: A High-Value Industrial Opportunity
The framework reported Indian copper consumption at approximately 6.7 lakh tonnes in 2018, with electrical and electronic industries as the largest consumers, and highlighted expected demand growth of approximately 6–7%. It also connected future copper demand with electric-vehicle infrastructure and projected an additional 1.7 million tonnes of EV-related copper demand by 2027.
Potential copper scrap streams
Copper wire; cable scrap; electrical components; transformers; motors; industrial equipment; manufacturing rejects; electronic equipment.
Zinc and Lead Recycling Opportunities
The framework reported zinc demand growth of approximately 1.89% CAGR while domestic production declined at approximately 1.3% CAGR during the period assessed; imports increased at approximately 2.10% CAGR.
Lead is important because of its extensive use in batteries. The framework highlighted automotive applications at approximately 60% of lead-acid battery demand and identified informal/backyard recycling as an environmental concern.
Hazardous streams require appropriate authorization and handling and should be routed to authorized recyclers.
The Real Business Opportunity Is Not the Scrap Yard
A traditional chain is Scrap generator → Local dealer → Larger dealer → Recycler. A larger opportunity is Factory → Collection network → Sorting centre → Processing hub → Recycler/steel mill/metal manufacturer.
This changes the business from simple trading into supply-chain infrastructure.
The B2B Industrial Scrap Collection Model
Step 1: Target factories instead of households
Auto-component manufacturers; engineering companies; fabrication units; electrical manufacturers; metal-processing companies; construction companies; warehouses; packaging manufacturers; appliance manufacturers; infrastructure contractors.
Offer managed scrap disposal
Service |
Possible offering |
Scrap pickup |
Scheduled pickup |
Weighment |
Digital weighment |
Sorting |
Material-wise segregation |
Grading |
Standardized grades |
Documentation |
Digital records |
Payment |
Fast settlement |
Reporting |
Monthly scrap report |
Compliance support |
Documentation/authorized disposal where applicable |
Hub-and-Spoke Scrap Business Model
The Ministry of Steel policy proposed a hub-and-spoke model in which collection/dismantling centres feed larger processing centres. A private company can use the same commercial logic.
Collection points → Local aggregation → Regional sorting yard → Processing hub → Industrial buyers/recyclers → Secondary raw material
Start With One Scrap Category
A new business should avoid handling every material from day one. A practical starting strategy is one material plus one industrial cluster: MS scrap in NCR; aluminium in Gujarat; copper around electrical manufacturing clusters; auto scrap around automobile hubs; engineering scrap around Pune; industrial scrap around Bengaluru.
Once supply and buyers are established, adjacent materials and processing can be added.
Scrap Processing Creates Additional Value
Potential processing activities include sorting, baling, shearing, magnetic separation, cable stripping, metal separation, shredding, size reduction, material grading and contamination removal.
The government framework emphasizes appropriate equipment, best available technology, trained manpower, environmental safeguards and record-keeping for organized recycling facilities.
The Digital Scrap Marketplace Opportunity
A technology layer can allow factories to list scrap, upload photographs, specify material and quantity, request pickup, schedule inspection, receive quotations, select buyers, track payment and maintain transaction history.
The government framework identified the potential for an online market/exchange for recycled and secondary metals.
Revenue Model
Revenue stream |
Business model |
Scrap trading |
Buy and sell scrap |
Collection contracts |
Managed collection |
Processing margin |
Add value through processing |
Logistics |
Pickup/delivery margin |
Sorting |
Value through better grading |
Marketplace |
Transaction commission |
Enterprise software |
Subscription |
Data services |
Scrap pricing/inventory analytics |
Compliance services |
Documentation/managed disposal |
Illustrative Business Model
A hypothetical network of 100 industrial customers generating an average 20 tonnes per month would represent 2,000 tonnes per month or 24,000 tonnes per year.
At an illustrative average gross trading spread of ₹1,000 per tonne, the gross trading spread would be ₹2.4 crore per year. This is a mathematical scenario, not a forecast or guaranteed margin.
Actual economics depend on material, grade, purchase price, selling price, transport, processing losses, inventory period, financing cost, local competition and payment terms.
Working Capital Is the Biggest Challenge
Scrap businesses can become capital-intensive because cash may need to be paid to suppliers before industrial buyers settle invoices. A safer starting approach can be confirmed buyer → factory pickup → aggregation → quick sale rather than speculative inventory.
Scrap Collection Density Is a Hidden Competitive Advantage
A dense cluster of customers can improve pickup utilization, fuel efficiency, vehicle productivity, route planning and customer service. Therefore, density can be more important than the raw number of customers.
Why Supply Is the Real Moat
Long-term factory relationships, recurring contracts, data, processing capacity and buyer networks are harder to replicate than a truck, warehouse or website.
Flywheel: More factories → More scrap volume → Better buyer relationships → Better pricing → More processing capacity → Higher-value output → More factories.
Employment Potential
The 2020 non-ferrous framework estimated approximately 3 million direct jobs in recycling facilities and 10–15 million indirect upstream jobs if recycling rates improved. These are historical policy estimates, not current employment figures.
The Steel Scrap Recycling Policy also projected employment potential through processing centres, collection centres, logistics and skilling.
Why Government Policy Supports the Industry
The policy direction is aligned with circular economy, resource efficiency, waste reduction, domestic secondary raw materials, reduced import dependence, scientific recycling, formalization, environmental compliance and employment generation.
The non-ferrous framework objectives include formalizing recycling, reducing carbon footprints, reducing landfill and pollution, generating employment and GDP, improving data, promoting the 6Rs, increasing high-quality scrap availability and reducing dependence on imported scrap.
The Informal Scrap Sector Is Not the Enemy
India already has a large network of informal collectors and dealers. An organized model can integrate these businesses as collection partners, suppliers, aggregators or franchise partners.
Organized company provides |
Local network provides |
Digital platform |
Local relationships |
Pricing information |
Collection capability |
Buyer access |
Market knowledge |
Documentation |
Supply |
Quality standards |
Local service |
Payment systems |
Pickup capability |
Compliance and Environmental Responsibility
The 2020 framework lists environmental and industrial legislation including the Environment Protection Act, Water Act, Air Act, Hazardous and Other Wastes Rules, E-Waste Rules, Battery-related rules and other regulations.
Exact approvals depend on material, process, location, storage, machinery, waste generated and state-specific requirements. Current state-specific regulatory advice should be obtained before establishing a processing facility.
Illustrative ₹10–25 Lakh Pilot
Expense |
Illustrative allocation |
Small yard/deposit |
₹2–4 lakh |
Basic equipment |
₹2–4 lakh |
Weighing/documentation setup |
₹0.5–1 lakh |
Vehicle/transport arrangement |
₹2–4 lakh |
Staff/operations |
₹1–2 lakh |
Working capital |
₹3–8 lakh |
Technology/marketing |
₹0.5–1 lakh |
Contingency |
₹1–2 lakh |
This is a business-planning illustration, not a quotation or market-validated cost estimate.
The 12-Month Growth Strategy
Months 1–3: Build supply
One city; one industrial cluster; one or two scrap categories; 20–30 potential factories; local collection partners; 5–10 reliable buyers.
Months 4–6: Build density
50+ industrial suppliers; regular pickup schedules; digital inventory; standard material grading; route optimization; buyer contracts.
Months 7–9: Add processing
Baling; sorting; cutting; segregation; material grading.
Months 10–12: Build the platform
Supplier dashboard; buyer dashboard; pickup booking; scrap listing; digital weighment; invoice management; payment tracking; price dashboard.
What Could Make This Business a ₹100-Crore Company?
Scrap is fundamentally a high-volume business. 10,000 tonnes per month equals 120,000 tonnes per year. At hypothetical gross contributions of ₹1,000, ₹2,000 and ₹3,000 per tonne, annual gross contribution would be ₹12 crore, ₹24 crore and ₹36 crore respectively.
These are mathematical scenarios, not forecasts. The required throughput to reach ₹100 crore in revenue depends heavily on the average value of materials traded.
From Scrap Dealer to Scrap Infrastructure Company
Stage |
Business |
Stage 1 |
Scrap trading |
Stage 2 |
B2B collection |
Stage 3 |
Aggregation & sorting |
Stage 4 |
Processing |
Stage 5 |
Digital marketplace + recycling ecosystem |
10 Scrap Recycling Business Ideas to Explore
1. Industrial Scrap Collection
Collect scrap directly from manufacturing companies under recurring contracts.
2. Aluminium Scrap Aggregation
Focus on aluminium from industrial and commercial sources.
3. Copper and Cable Scrap
Build a specialized collection and segregation business.
4. Auto Scrap Collection
Partner with vehicle dismantling and authorized recycling ecosystems.
5. Scrap Sorting Centre
Buy mixed scrap and create value through professional segregation.
6. B2B Scrap Marketplace
Connect factories with recyclers and industrial buyers.
7. Scrap Logistics
Provide dedicated pickup and transportation services.
8. Scrap Inventory Software
Build SaaS for scrap dealers, factories and recyclers.
9. Industrial Waste Management
Combine scrap with other recoverable industrial materials.
10. Regional Recycling Hub
Build a larger collection, sorting and processing centre serving multiple industrial clusters.
Why This Could Be India’s Next 'Boring Business'
Factories will continue to generate production rejects, metal offcuts, used machinery, packaging waste and old equipment. Manufacturers will continue to require raw materials. This creates a structural opportunity: waste generated → material recovered → secondary raw material → industrial production.
Final Business Strategy
A sensible starting point is one city, one industrial cluster, one or two materials and a small group of factories. Prove the collection and buyer model first.
Then move from Collect → Grade → Aggregate → Sell to Collect → Grade → Aggregate → Process → Sell, and ultimately to Factories → Digital platform → Collection network → Processing hub → Industrial buyers.
The long-term opportunity is to build a technology-enabled circular-economy infrastructure company rather than another conventional scrap dealership.
Key Data at a Glance
Indicator |
Data / finding |
Source |
Historical domestic ferrous scrap |
25 MT |
Ministry of Steel |
Historical imported ferrous scrap |
7 MT |
Ministry of Steel |
Historical scrap consumption |
~32 MT |
Ministry of Steel / Trade.gov |
Historical scrap deficit |
~7 MT |
Ministry of Steel |
Historical scrap imports value |
>₹24,500 crore |
Ministry of Steel |
Aluminium consumption FY2020(E) |
3.7 MT |
Ministry of Mines |
Aluminium demand CAGR |
6.77% |
Ministry of Mines |
Aluminium energy saving through recycling |
95% |
Ministry of Mines |
Copper consumption in 2018 |
~6.7 lakh tonnes |
Ministry of Mines |
Copper demand growth expectation |
6–7% |
Ministry of Mines |
EV-related copper demand projection |
+1.7 MT by 2027 |
Ministry of Mines |
Aluminium recycling rate in framework |
30% |
Ministry of Mines |
Copper recycling rate in framework |
20% |
Ministry of Mines |
Zinc recycling rate in framework |
10% |
Ministry of Mines |
Lead recycling rate in framework |
85% |
Ministry of Mines |