

Executive summary
India’s commodity-wise export report points to a diverse export economy. In the report, total exports are listed at US$441.45 billion for FY 2025–26, up 0.86% from US$437.70 billion in FY 2024–25. Electrical machinery and equipment rose 22.54% to US$53.98 billion, while machinery and mechanical appliances reached US$36.63 billion. Vehicles and auto components grew 14.68% to US$25.97 billion, and pharmaceutical products reached US$25.07 billion. Copper and articles of copper grew 61.98%, albeit from a much smaller base of US$2.07 billion to US$3.36 billion.
The data is useful for identifying sectors worth investigating, not for guaranteeing profitability. A viable export business also depends on buyer access, product quality, compliance, logistics, working capital, pricing and competition.
1. India’s largest export categories
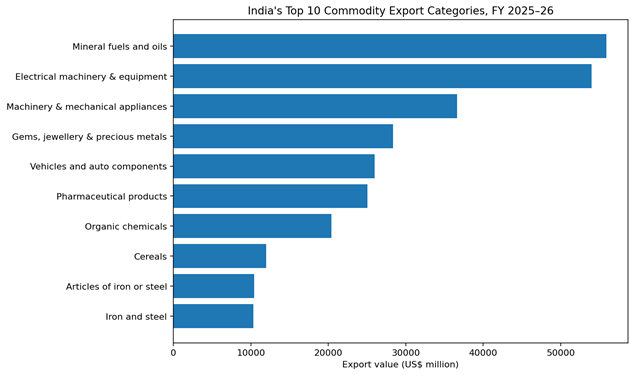
The chart ranks the ten largest commodity categories in the report by FY 2025–26 export value. Values are shown in US$ million; the table converts them into US$ billion for easier reading.
HS chapter |
Commodity category |
FY 2025–26 exports |
Share |
Growth |
HS 27 |
Mineral fuels and oils |
$55.87bn |
12.66% |
-16.67% |
HS 85 |
Electrical machinery & equipment |
$53.98bn |
12.23% |
+22.54% |
HS 84 |
Machinery & mechanical appliances |
$36.63bn |
8.30% |
+9.42% |
HS 71 |
Gems, jewellery & precious metals |
$28.34bn |
6.42% |
-5.39% |
HS 87 |
Vehicles and auto components |
$25.97bn |
5.88% |
+14.68% |
HS 30 |
Pharmaceutical products |
$25.07bn |
5.68% |
+2.02% |
HS 29 |
Organic chemicals |
$20.41bn |
4.62% |
+1.43% |
HS 10 |
Cereals |
$12.01bn |
2.72% |
-5.84% |
HS 73 |
Articles of iron or steel |
$10.41bn |
2.36% |
+2.26% |
HS 72 |
Iron and steel |
$10.32bn |
2.34% |
+11.52% |
Interpretation: mineral fuels and oils remained the largest listed category at US$55.87 billion, but declined 16.67%. Electrical machinery and equipment was close behind at US$53.98 billion and grew 22.54%. This contrast matters: a large export value does not automatically mean a sector is growing, and a fast-growing sector may still be relatively small.
2. Fast-growing export categories to investigate
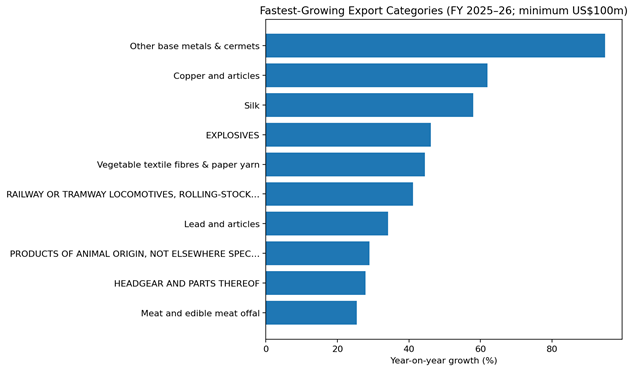
The next chart highlights categories with at least US$100 million in FY 2025–26 exports and the highest reported year-on-year growth. The minimum-value filter avoids giving undue weight to tiny categories with volatile growth rates.
HS chapter |
Commodity category |
FY 2024–25 |
FY 2025–26 |
Growth |
HS 81 |
Other base metals & cermets |
$0.15bn |
$0.30bn |
+94.84% |
HS 74 |
Copper and articles |
$2.07bn |
$3.36bn |
+61.98% |
HS 50 |
Silk |
$0.16bn |
$0.26bn |
+58.01% |
HS 36 |
EXPLOSIVES |
$0.38bn |
$0.56bn |
+46.14% |
HS 53 |
Vegetable textile fibres & paper yarn |
$0.61bn |
$0.88bn |
+44.50% |
HS 86 |
RAILWAY OR TRAMWAY LOCOMOTIVES, ROLLING-STOCK… |
$0.36bn |
$0.50bn |
+41.16% |
HS 78 |
Lead and articles |
$0.95bn |
$1.27bn |
+34.16% |
HS 05 |
PRODUCTS OF ANIMAL ORIGIN, NOT ELSEWHERE SPEC… |
$0.29bn |
$0.37bn |
+28.93% |
HS 65 |
HEADGEAR AND PARTS THEREOF |
$0.09bn |
$0.12bn |
+27.88% |
HS 02 |
Meat and edible meat offal |
$4.16bn |
$5.22bn |
+25.40% |
Copper and articles of copper, silk, other base metals/cermets, vegetable textile fibres and paper yarn, and railway rolling stock/parts all recorded strong percentage growth in the report. These are signals to investigate demand and buyers—not proof that new exporters can enter easily or earn high margins.
3. Export business ideas suggested by the data
The following ideas are business hypotheses inferred from the commodity trends. Validate them with HS-code-level product research, buyer interviews, destination-market rules, competitor pricing and a landed-cost model before investing.
Electrical components and equipment sourcing/export
Data signal: Electrical machinery and equipment exports reached US$53.98bn and grew 22.54%.
Possible entry angle: Start with a narrow, traceable product family such as cable assemblies, electrical fittings, control-panel components or selected industrial parts. Build supplier quality checks and documentation.
Key risks to validate: Potentially complex specifications, certifications, warranty obligations and working-capital needs.
Engineering parts and machinery components
Data signal: Machinery and mechanical appliances reached US$36.63bn, up 9.42%.
Possible entry angle: Explore precision components, fabricated parts, replacement parts or niche machinery accessories for industrial distributors and OEM buyers.
Key risks to validate: Tolerance, testing, technical drawings, delivery reliability and after-sales support.
Automotive parts and accessories
Data signal: Vehicles and parts reached US$25.97bn, up 14.68%.
Possible entry angle: Consider a focused range of non-safety-critical replacement parts, metal/plastic components or accessories, supported by reliable manufacturers and clear fitment data.
Key risks to validate: Product liability, homologation or destination-specific requirements, returns and SKU complexity.
Pharmaceutical products and contract services
Data signal: Pharmaceutical exports reached US$25.07bn, up 2.02%.
Possible entry angle: For qualified firms, investigate regulated-market niches, contract manufacturing or distribution partnerships. Smaller entrants may need to begin with compliant B2B sourcing rather than building a plant.
Key risks to validate: Strict regulatory approvals, quality systems, audits and high entry barriers; not a casual beginner category.
Copper products and semi-finished goods
Data signal: Copper and articles of copper grew 61.98% to US$3.36bn.
Possible entry angle: Investigate copper components, fabricated parts or specialized industrial products where a clear buyer specification and dependable raw-material sourcing exist.
Key risks to validate: Commodity-price volatility, metal financing, quality specifications and thin margins.
Food and agricultural export niches
Data signal: Cereals exports were US$12.01bn, down 5.84%; meat and edible meat offal were US$5.22bn, up 25.40%; fish and seafood were US$7.02bn, up 11.43%.
Possible entry angle: Look for buyer-led opportunities in processed or value-added foods, subject to product-specific export eligibility and destination-country rules.
Key risks to validate: Perishability, traceability, food safety, cold chain and policy/market access changes.
Textile and silk niches
Data signal: Silk exports rose 58.01% to US$257m; other vegetable textile fibres/paper yarn grew 44.50% to US$882m.
Possible entry angle: Explore differentiated fabrics, yarn, textile inputs or small-batch private-label supply to importers and manufacturers.
Key risks to validate: Consistency, fibre specifications, fashion cycles, sustainability claims and buyer sampling.
4. Selected categories: year-on-year comparison
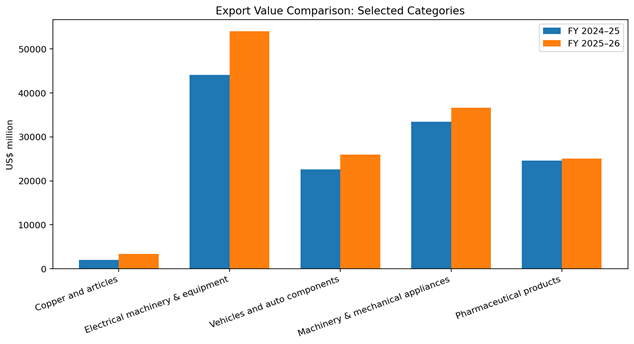
The comparison shows the absolute scale of several engineering-oriented categories. Electrical machinery added nearly US$9.93bn in reported exports year on year; machinery and mechanical appliances added about US$3.15bn; and vehicles and parts added about US$3.32bn. Copper and articles added about US$1.29bn from a smaller base.
5. Categories where caution is warranted
Several large categories declined in FY 2025–26. Mineral fuels and oils fell 16.67% to US$55.87bn; gems, jewellery and precious-metal-related goods fell 5.39% to US$28.34bn; cereals fell 5.84% to US$12.01bn; and plastics and articles fell 6.87% to US$7.60bn. A decline does not mean a sector is unattractive, but it calls for closer checks on price movements, global demand, policy changes, supply availability and the exact products inside each broad HS chapter.
HS chapter |
Category |
FY 2025–26 exports |
Growth |
HS 47 |
PULP OF WOOD OR OF OTHER FIBROUS CELLULOSIC M… |
$0.00bn |
-84.41% |
HS 88 |
AIRCRAFT, SPACECRAFT, AND PARTS THEREOF |
$1.67bn |
-76.08% |
HS 43 |
FURSKINS AND ARTIFICIAL FUR, MANUFACTURES THE… |
$0.00bn |
-38.36% |
HS 98 |
PROJECT GOODS |
$0.01bn |
-25.28% |
HS 27 |
Mineral fuels and oils |
$55.87bn |
-16.67% |
6. How to choose the right export business
1.Choose a specific product—not just a broad industry. Identify the exact HS code and product specification.
2.Check the destination market. Review import rules, product standards, labelling, duties and any licensing or restricted-product requirements.
3.Find real buyers before scaling. Build a list of importers/distributors and request feedback on specifications, samples, volumes and target prices.
4.Calculate landed economics. Include factory price, packaging, inland freight, port/handling, documentation, freight, insurance, duties borne by the buyer or seller, payment fees, commission, returns and financing.
5.Validate supply reliability. Audit at least two suppliers where practical, check capacity, quality records, lead times and consistency.
6.Protect cash flow. Model the cash conversion cycle, payment terms, deposits, foreign-exchange exposure and delayed-payment scenarios.
7.Run a small pilot shipment where feasible, measure actual costs and buyer feedback, then scale only when repeat demand and contribution margin are demonstrated.
7. A simple export unit-economics worksheet
Before committing capital, calculate contribution per unit and break-even volume. Use your own product and shipment quotes; the values below are illustrative only.
Metric |
Illustrative value |
How to use it |
Selling price per unit |
US$20.00 |
Confirmed buyer price, not a market assumption |
Total variable cost per unit |
US$15.00 |
Product, packing, variable freight/handling, commissions and other variable costs |
Contribution per unit |
US$5.00 |
Selling price minus variable cost |
Monthly fixed operating cost |
US$5,000 |
Staff, rent, systems, compliance overhead and other fixed costs |
Break-even units per month |
1,000 |
Fixed costs ÷ contribution per unit |
This simplified calculation excludes tax, interest, one-time setup costs, foreign-exchange movements and unexpected claims. Build a shipment-level cash-flow model before making a decision.
Conclusion
FY 2025–26 data shows major scale in fuels, electrical machinery, engineering goods, gems and jewellery, vehicles and pharmaceuticals. It also shows strong growth in smaller categories such as copper and silk. For an entrepreneur, the most useful conclusion is not to chase the biggest number or fastest growth rate blindly. Select a narrow product, verify demand with buyers, understand compliance and prove profitable shipment economics before scaling.
Source and methodology notes
Primary source: TradeStat–EIDB Export Commodity-wise Excel report, generated 10 October 2026. The sheet states that values are in US$ million.
The report’s total row lists India’s total exports as US$437,704.58 million in FY 2024–25 and US$441,452.14 million in FY 2025–26, growth 0.86%. Commodity-level rankings in this article exclude the total row to avoid double-counting.
Commodity shares sum to approximately 100% in the data (small rounding differences may occur). The article preserves the report’s commodity chapter groupings; these are broad categories, not individual product-level recommendations.
All opportunity suggestions are analytical hypotheses based on the export values and growth rates. They are not a guarantee of demand, eligibility, profitability or market access. Verify current product-specific rules and official trade data before publication or investment.
For a public web article, link directly to the original official TradeStat/EIDB report or its source page if available, and state the data period, currency, unit and report generation date.