Prepared using the July 2026 DPIIT Toy Sector Playbook, PIB’s 2026 release, and the supplied background paper.
Executive summary
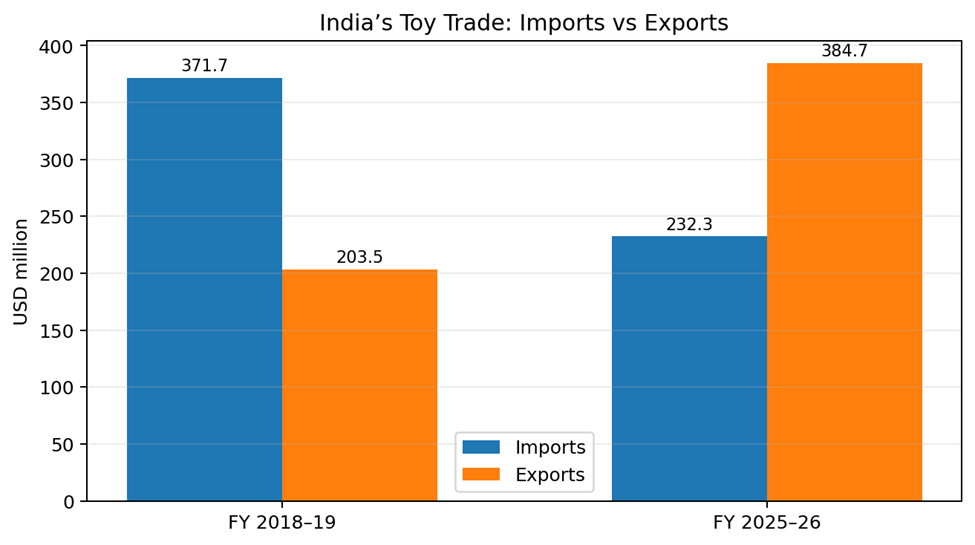
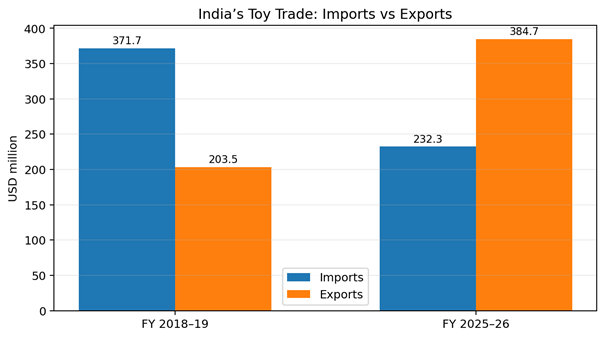
India’s toy sector is moving from import dependence toward a stronger domestic manufacturing and export position. The most useful signal is trade: according to the Press Information Bureau (PIB), toy imports declined from USD 371.7 million in FY 2018–19 to USD 232.3 million in FY 2025–26, while exports increased from USD 203.5 million to USD 384.7 million. This is a 37.5% fall in imports and an 89.1% rise in exports.
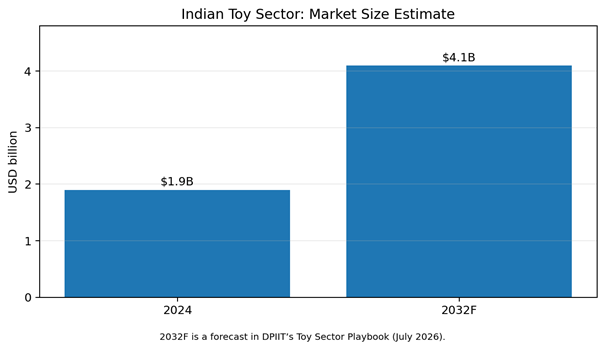
DPIIT’s July 2026 Toy Sector Playbook estimates the Indian toy sector at USD 1.9 billion in 2024 and projects USD 4.1 billion by 2032. The same playbook estimates the global sector at USD 113.9 billion in 2024 and USD 184.3 billion by 2032. These are market estimates and forecasts—not guaranteed outcomes or a promise of returns.
For a new entrepreneur, the opportunity is not simply to produce a generic toy cheaply. It is to select a focused product category, design for safety and manufacturability, build compliance into the process from the beginning, and secure distribution before investing heavily in machinery. Wooden and traditional toys, educational/STEM products, pretend play, puzzles, and selected plastic or electronic products can each suit different levels of capital and capability.
1. India’s toy market: size, growth and context
The DPIIT Toy Sector Playbook (July 2026) reports a 2024 Indian toy-sector estimate of USD 1.9 billion and a 2032 forecast of USD 4.1 billion, implying an approximately 10.1% compound annual growth rate (CAGR) for the period used in the playbook. The playbook describes India’s expected growth as about 1.5 times the global average over 2024–2032.
Indicator |
Reported value |
How to interpret it |
Indian toy sector, 2024 |
USD 1.9 billion |
DPIIT Playbook estimate |
Indian toy sector, 2032F |
USD 4.1 billion |
Forecast; not an actual result |
Implied CAGR, 2024–2032 |
10.1% |
Forecast growth rate stated in the Playbook |
Global toy sector, 2024 |
USD 113.9 billion |
DPIIT Playbook estimate |
Global toy sector, 2032F |
USD 184.3 billion |
Forecast based on approximately 6.2% CAGR |
India population aged 0–14 |
Approximately 357 million / ~25% |
Playbook’s demand-context indicator |
Why demand could expand: a large child population; greater online discovery and e-commerce reach; increased attention to play-based learning; demand for products linked to Indian stories and culture; and opportunities to supply international buyers seeking additional manufacturing locations. These drivers create a market opportunity, but a manufacturer still needs product-market fit, safe design, working capital and reliable distribution.
2. The strongest measurable signal: imports and exports
The PIB release dated 28 July 2026 says India’s toy industry has become a net exporter using the reported toy trade basket (HS 9503, 9504 and 9505). Exports exceeded imports by USD 152.4 million in FY 2025–26 on these figures.
Trade metric |
FY 2018–19 |
FY 2025–26 |
Change |
Imports from world |
USD 371.7m |
USD 232.3m |
−37.5% |
Exports to world |
USD 203.5m |
USD 384.7m |
+89.1% |
Trade balance (exports − imports) |
−USD 168.2m |
+USD 152.4m |
Swing of USD 320.6m |
Business implication: there is evidence of export momentum, but a new company should not treat export growth as automatic demand for its own products. Buyers will evaluate consistent quality, documentation, product testing, capacity, lead times, packaging, price, and the ability to replenish orders.
The DPIIT Playbook’s separate trade analysis says India’s toy exports grew at about 11% CAGR during 2020–2025 versus 4.5% for global toy exports, while India accounted for about 0.3% of global toy exports in 2025. This suggests room to expand, alongside substantial competition and compliance requirements.
3. Where manufacturing is concentrated
The DPIIT Playbook uses Annual Survey of Industries (ASI) 2023–24 data for organised/registered toy manufacturing facilities under NIC 324. It estimates 213 organised factories and notes that ASI does not enumerate every informal or unregistered producer. The percentages below therefore describe the organised-factory distribution, not every toy maker in India.
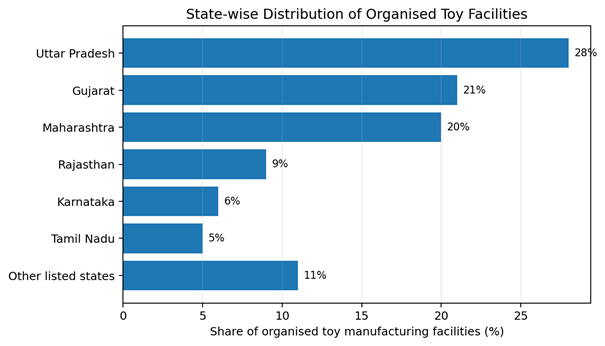
State / group |
Share in Playbook chart |
Potential consideration for entrepreneurs |
Uttar Pradesh |
28% |
Large reported organised-facility share; evaluate industrial areas, supplier access and buyer proximity. |
Gujarat |
21% |
Strong reported share; assess plastics, components, logistics and relevant industrial infrastructure. |
Maharashtra |
20% |
Large reported share; assess supplier ecosystem, talent, distribution and operating costs. |
Rajasthan |
9% |
Potential location to assess for selected toys, crafts and NCR-linked distribution. |
Karnataka |
6% |
Relevant to the broader toy cluster ecosystem and manufacturing networks. |
Tamil Nadu |
5% |
Assess industrial suppliers, engineering capability and logistics. |
Other listed states |
11% combined |
Includes Haryana, Delhi, West Bengal, Telangana, Andhra Pradesh and Kerala in the chart. |
Location decision: do not choose a state from its percentage alone. Compare land or rent, labour, electricity, tooling and component suppliers, freight, access to testing laboratories, proximity to target customers, and state-specific incentives. Verify current incentive rules directly with the relevant state department before including them in a financial model.
4. Product categories and market gaps worth testing
Product direction |
Why it may be worth testing |
Main execution challenge |
Educational and STEM toys |
Can align with play-based learning and parent/educator demand. |
Prove learning value; validate age grading, durability and safety. |
Traditional / wooden / craft toys |
Differentiation through Indian stories, regional craft and gifting. |
Repeatable quality, finish consistency, child-safe coatings and scalable production. |
Puzzles, construction and activity sets |
Can support learning, repeatable product families and bundles. |
Small-part risks, material quality, clear instructions and competitive design. |
Pretend-play and role-play toys |
Can localise themes to Indian everyday life and professions. |
Design originality, durability and packaging volume. |
Selected plastic toys |
Potential for repeat production at scale where volumes justify tooling. |
Mould costs, competition, material traceability and quality control. |
Electronic toys |
Potential for interactive features and differentiated functionality. |
Electrical safety, component sourcing, testing, repairs and higher complexity. |
Private-label / contract manufacturing |
B2B buyers may supply demand and brand access without building a consumer brand first. |
Buyer audits, margins, delivery performance and dependence on a few customers. |
Treat these as hypotheses to validate, not proven gaps. Before tooling, interview retailers, online sellers, preschools, distributors and potential export buyers. Ask what they currently buy, what fails, target landed price, minimum order quantity, packaging expectations, testing documents, reorder frequency and why they would switch suppliers.
5. Choose the right business model
Model |
What the company controls |
Best fit / trade-off |
Contract manufacturer |
Factory operations, production, quality and supply chain. |
Fits operators who can win B2B orders and run production reliably; brand-building spend may be lower. |
Toy brand owner |
Product concept, design, packaging, marketing and sales; production is outsourced. |
Can start with lower factory capex, but depends on suppliers and needs strong distribution and customer acquisition. |
Hybrid manufacturer + brand |
Product design, development, production, packaging and marketing. |
More control and potential differentiation, but requires more capital, skills and management bandwidth. |
For first-time founders, a staged model can reduce risk: validate demand through small batches or contract production, obtain buyer feedback, and only then purchase specialised machinery. Any outsourcing model must still ensure that the responsible manufacturer and seller meet applicable toy safety and certification obligations.
6. Manufacturing value chain: from idea to shelf
1. Concept and user research: define age group, play purpose, price band, buyer and competing products.
2. Design and engineering: drawings, prototypes, materials, mechanisms, age grading and design-for-manufacture review.
3. Supplier qualification: identify material and component suppliers; define specifications, traceability and incoming inspection.
4. Production: establish repeatable processes, work instructions, in-process checks and batch records.
5. Testing and certification: classify the product correctly and confirm applicable Indian Standards and BIS requirements before sale.
6. Packaging and instructions: communicate age grading, warnings, assembly/use instructions and brand value.
7. Route to market: choose B2B wholesale, retailers, marketplaces, direct-to-consumer, educational institutions, or export buyers.
8. After-sales and improvement: track returns, defects, complaints, reorder data and corrective actions.
7. BIS certification and toy safety: treat this as a launch gate
The DPIIT Playbook states that toys designed or intended for play by children under 14 must comply with applicable Indian Standards and carry the BIS Standard Mark under a valid licence, subject to the applicable rules and exemptions, if any. It distinguishes non-electric toys (IS 9873 series, as applicable) and electric toys (IS 15644). The Playbook indicates that separate BIS licences are granted for the two categories.
Area |
Practical action |
Classify the toy |
Confirm whether it is electric or non-electric and identify the applicable standards for the product. |
Prepare technical file |
Product specifications, bill of materials, drawings, samples, supplier details and intended age group. |
Testing and licence |
Use BIS-recognised laboratories and follow the current BIS application and conformity-assessment process. |
Production controls |
Maintain quality-control records, batch traceability, test reports, corrective actions and surveillance readiness. |
Export requirements |
Check the destination market’s rules and buyer-specific requirements; examples can include EN 71, ASTM F963 or other applicable standards. |
Budget and timing |
The Playbook’s indicative timelines vary by step and process. Confirm current lead times and fees with BIS and the selected laboratory. |
Important: do not rely on old articles or informal estimates for current certification costs, exemptions, standards or timelines. Verify the current Toys (Quality Control) Order, BIS guidance, product classification and any applicable amendments before committing to launch dates or accepting orders.
8. Government ecosystem and export opportunities
The PIB release reports several measures intended to improve domestic capability and quality:
- National Action Plan for Toys with 21 action points coordinated by 14 ministries and departments.
- More than 1,800 BIS licences for domestic toy manufacturers, plus more than 50 for foreign manufacturers, as reported in the release.
- Toy cluster support: 18 clusters approved by the Ministry of MSME under SFURTI, and design/tooling support for 40 clusters from the Ministry of Textiles.
- More than 700 DPIIT-recognised toy startups and support to more than 2,200 exporters under RoDTEP, according to the PIB release.
- Toy fairs and B2B exhibitions: the release says Toy Biz International 2026 featured 400 Indian brands, 100 international buyers from 40 countries and around 30,000 business visitors.
- Trade agreements may provide preferential market access for eligible products, but tariff treatment depends on rules of origin, product classification and agreement-specific conditions.
The PIB release explicitly says there is no dedicated toy policy of the Government of India at present. Entrepreneurs should therefore avoid describing the ecosystem as one single dedicated national toy-policy subsidy. Scheme eligibility and current application windows must be checked with the implementing department.
9. Machinery, capital and unit economics: build a quote-based model
There is no reliable one-size-fits-all investment figure for a toy factory. Capex depends on product type, production volume, automation, mould complexity, land/building, finishing, testing and whether components are manufactured in-house or purchased. The DPIIT Playbook lists machinery and tooling by segment, including injection-moulding and blow-moulding machines for relevant plastic products, soldering equipment for selected electronic products, and dies, moulds, jigs and fixtures.
Cost bucket |
Items to include in the business plan |
Premises and utilities |
Lease/deposit or land/building, electrical load, compressed air, ventilation, fire safety and fit-out. |
Machinery and tooling |
Production equipment, moulds, dies, fixtures, maintenance, installation and operator training. |
Product development |
Industrial design, prototypes, testing iterations, packaging design and tooling changes. |
Compliance and quality |
Laboratory testing, BIS-related expenses, quality systems, inspection instruments and documentation. |
Materials and inventory |
Raw materials, purchased components, packaging, safety stock, rejected material and work in progress. |
People and operations |
Operators, supervisor, quality personnel, design/engineering, sales, accounting and statutory costs. |
Working capital |
Supplier advances, production cycle, buyer credit, marketplace fees, freight and returns. |
Sales and distribution |
Samples, catalogues, trade fairs, commissions, digital marketing and export documentation. |
A simple break-even framework
Use actual supplier quotations and pilot data; the following is a formula, not a market estimate.
Contribution per unit = Net selling price per unit − Variable cost per unit
Monthly break-even units = Monthly fixed costs ÷ Contribution per unit
Example only: if net realisation is ₹300 per unit, variable cost is ₹180, and monthly fixed costs are ₹6,00,000, contribution is ₹120 and break-even is 5,000 units per month. This excludes any additional financing, tax or one-off costs not included in the fixed-cost figure.
Illustrative assumption (not industry data) |
Value |
Net realisation per unit |
₹300 |
Variable cost per unit |
₹180 |
Contribution per unit |
₹120 |
Monthly fixed costs |
₹6,00,000 |
Break-even volume |
5,000 units/month |
10. Go-to-market: secure buyers before scaling
9. Select one initial category and a narrow age/price segment; avoid launching a large catalogue immediately.
10. Create a sample set and product dossier containing dimensions, materials, age grading, safety information, test/certification status and packaging specs.
11. Interview and sample to retailers, distributors, online sellers, schools/preschools where relevant, corporate gifting buyers and export sourcing teams.
12. Test online demand with limited SKUs and track conversion, returns, ratings, repeat purchase and contribution after fees and shipping.
13. For B2B, calculate minimum order quantity, tooling recovery, payment terms, production lead time and penalty exposure before quoting.
14. For export, research destination-specific safety rules, tariff classification, rules of origin, logistics and buyer audit expectations.
15. Scale only after repeat orders, acceptable defect rates and positive contribution margins are demonstrated.
11. Risk register
Risk |
Why it matters |
Mitigation |
Certification delays or failure |
Can postpone launch or block sales. |
Confirm classification and testing plan before finalising design or delivery commitments. |
Demand overestimation |
Market growth does not guarantee demand for an individual SKU. |
Run buyer interviews and paid pilots; validate reorders rather than relying on forecasts. |
Tooling and capex lock-in |
Custom moulds and equipment can be expensive to change. |
Use prototypes, modular designs and outsourced pilots before buying dedicated machinery. |
Price competition |
Generic toys may face intense price pressure. |
Differentiate through function, safety, design, durability, cultural relevance or B2B service. |
Working-capital squeeze |
Inventory and long buyer payment cycles can absorb cash. |
Model cash conversion cycle, negotiate advances and avoid overproduction. |
Export-market complexity |
Standards, documentation and buyer expectations vary. |
Verify each destination’s current rules and work with qualified export/logistics advisers. |
Quality inconsistency |
Defects damage trust and can trigger returns or recalls. |
Use approved suppliers, traceability, batch checks and corrective-action processes. |
12. Practical 90-day launch roadmap
Period |
Priority actions |
Output / decision gate |
Days 1–15 |
Choose 2–3 product concepts; map competitors and price points; interview 15–25 prospective buyers. |
One category and target customer supported by evidence. |
Days 16–30 |
Prepare prototypes, BOM, supplier shortlist, target cost and preliminary compliance review. |
Prototype and quote-based unit economics. |
Days 31–45 |
Test samples with buyers; obtain machinery/tooling quotes; map BIS and destination-market requirements. |
Go/no-go based on feedback, cost and compliance feasibility. |
Days 46–60 |
Refine design, packaging, testing plan and manufacturing process; negotiate pilot orders. |
Pilot specification, quality plan and credible delivery schedule. |
Days 61–90 |
Run a controlled pilot; record defects, costs, lead times, returns and buyer feedback; secure repeat orders. |
Decision to scale, redesign, outsource further or stop. |
The timeline is a planning template, not a promise that BIS certification, tooling or production can be completed within 90 days. Product complexity and approvals may extend the schedule.
Conclusion: the opportunity is real, but execution decides the outcome
India’s toy manufacturing story is supported by two clear indicators in the supplied sources: the DPIIT Playbook’s market-growth forecast and PIB’s reported shift toward higher exports and lower imports. The manufacturing ecosystem includes MSMEs, toy clusters, traditional craft capabilities, organised factories and policy-led quality infrastructure.
The strongest entry strategy is disciplined rather than speculative: identify a product niche, validate buyers, calculate unit economics using real quotations, make compliance part of product design, and expand only when quality and repeat demand are proven. Entrepreneurs who combine original design, dependable production and access to buyers will be better positioned than businesses that rely on low price alone.
Data integrity note: trade figures are reported by PIB for HS 9503, 9504 and 9505. DPIIT’s market-size numbers are estimates/forecasts. ASI state shares cover organised/registered facilities under NIC 324 and should not be interpreted as a census of all informal manufacturers. Historical numbers from the supplied background paper are older and may use different definitions; they have not been mixed into the current charts.
Editorial note: This document is a business-research article, not legal, certification, tax, investment or financial advice. Verify current rules and scheme eligibility with official authorities before making commitments.